MS 150 Statistics Spring 2001 Midterm Examination Lee Ling
| Statistic |
Equations |
Excel |
| Mean |
=  = x P(x) = x P(x) |
=AVERAGE(data) |
| Sample Standard Deviation |
= sx
=  |
=STDEV(data) |
| Population Standard Deviation |
= 
= sx |
=STDEVP(data) |
| Slope |
|
=SLOPE(y data, x data) |
| Intercept |
|
=INTERCEPT(y data, x data) |
| Correlation |
|
=CORREL(y data, x data) |
Examination note: Numbers 16, 17, 26, and 27 are interpretation and analysis questions.
These should be answered using complete sentences and paragraph structure on a
separate sheet of paper. This examination can be, if you choose, typed up, printed
and turned in or submitted by email to dleeling@comfsm.fm
.
The test is due Friday morning 10:00 A.M. 02 March 2001.
I. Descriptive Statistics
The following data gives the number of Liberal Arts/Pre-Nursing students at the College
of Micronesia-FSM from 1995 to 2001. In the first column is the year, with year 0
being 1995 and year being 2001. Note that this is seven years in all. The first
section uses the second column, the y data, to obtain some descriptive statistics.
| Year, where 1995 is year 0 (x) |
Number of students in nursing program (y) |
| 0 |
44 |
| 1 |
38 |
| 2 |
28 |
| 3 |
20 |
| 4 |
18 |
| 5 |
12 |
| 6 |
3 |
- What level of measurement is the number of nursing students y data?
- _______ What is the mean number of nursing students (
 ) for these seven years?
- _______ What is the median number of nursing students?
- _______ What is the mode of the number of nursing students?
- _______ What is the sample standard deviation sy of the number of nursing students?
- _______ What is the sample Coefficient of Variation of number of nursing students?
II. Linear Regression
Use the data from Section I to complete this section.
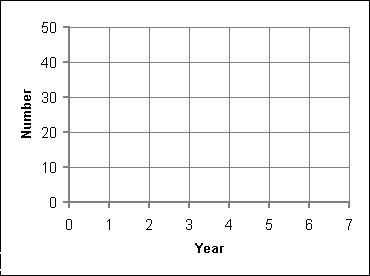
- Plot the data from section one on the following graph:

- _______ Calculate the slope of the least squares (best fit) line.
- _______ Calculate the intercept of the least squares (best fit) line.
- _______ Using the least squares line equation, what year will the LA/pre-nursing program
have zero students?
- _______ The Pearson product-moment correlation will indicate whether the growth can be
reasonably modeled by a linear equation. What is the correlation r for the data in
section I?
- Is the correlation...
- perfect negative correlation
- highly negative correlation
- moderately negative correlation
- no correlation
- moderately positive correlation
- highly positive correlation
- perfect positive correlation
- _______ What is the Coefficient of Determination r² for the data in section I?
- What does the Coefficient of Determination tell us?
- _______ Is the rate of change reasonably well modeled by a linear equation?
- Why?
- What does the data tell us about the condition of the pre-nursing program at the
College? (Use a separate sheet of paper)
- Think of yourself as an administrator at the College. Imagine yourself as a chair,
director, vice-president, comptroller, or president. You choose the viewpoint you
wish to take. What recommendations would you make for the pre-nursing program at the
College and WHY? (Use a separate sheet of paper)
III Histograms and Probability Distributions
At the national campus the distribution of grades for pre-nursing majors in courses
from 1995 to present is given in the table below. The second row of the table can be read
in the following manner: "89 grades of A were awarded to pre-nursing majors between
Spring 1995 and Fall 2000."
| Grade |
Grade Point Value (x) |
Frequency or Count |
Rel. Freq. or P(x) |
x P(x) |
(x-m)²P(x) |
| A |
4 |
89 |
» |
» |
» |
| B |
3 |
238 |
» |
» |
» |
| C |
2 |
346 |
» |
» |
» |
| D |
1 |
204 |
» |
» |
» |
| F or W |
0 |
354 |
» |
» |
» |
|
Sums: |
» |
» |
» |
» |
|
|
|
|
|
» |
- Calculate the probability distribution (the relative frequencies) for each grade
and record the results in the table above.
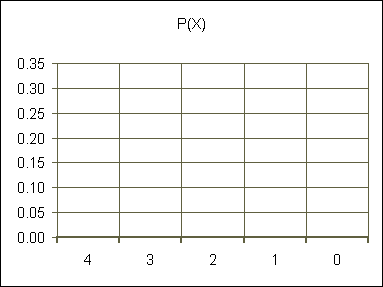
- Make a histogram of the probability distribution (relative frequency histogram) using
the Grade Point Values for the x axis as seen below.

- What is the shape of the distribution?
- _______ Based on the data, what is the probability that a randomly selected pre-nursing
student will have a grade of "B" in a class in the class?
- _______ Calculate P(C or D).
- _______ Calculate the mean of the data.
- Is the mean above or below the Pell eligibility grade point average requirement?
- _______ Calculate the standard deviation of the data.
- What explanations for the trend data presented in section 1 does the grade distribution
data suggest? In other words, does the data of section III help explain the trend seen in
section I and WHY? (Use a separate sheet of paper)
- What suggestions would you make for improving the grade distribution data. Give me
realistic solutions that the College could conceivably implement. (Use a separate sheet of
paper)
Lee Ling home
COM-FSM home page

