Pair up. Maybe with someone new and different. For each round object, measure the diameter and circumference in centimeters using a ruler. In order to measure the circumference, roll the round object once on a sheet of paper and measure the distance for one full rotation.
Record you data in the following table:
| diameter/cm | circumference/cm |
|---|---|
| 0 | 0 |
| __________ | __________ |
| __________ | __________ |
| __________ | __________ |
| __________ | __________ |
| __________ | __________ |
If an object has a diameter of zero, what will the circumference be? Why?
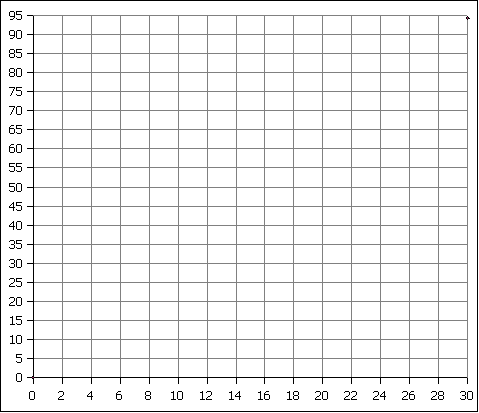
Plot the data above on the graph below.
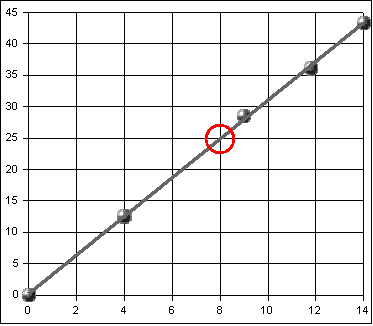
Draw a straight line through the points using the ruler. Near the upper right corner of the graph try to find a place where the line you drew goes through an intersection of the graph grid lines. The diagram below shows an example. In this example the x-value for the intersection is 8 cm, the y-value for the intersection is 25 cm.
Using your own graph find an intersection your line passes through. Record the x-value for that intersection and the y-value for that intersection. Divide the y-value by the x-value to get the circumference to diameter ratio. Write your ratio on the board.
Intersection y-value: __________
Intersection x-value:__________
Ratio = y-value ÷ x-value = ______________
After writing the ratios on the board, consider whether everyone got nearly the same ratio. This ratio, which is the slope of the line, is called pi (π). The formula you graphed is circumference = pi* diameter. This is an equation of the form y = mx where the slope m is pi (π).
HW: Using the ratios for the entire class, calculate the average ratio for the whole class: