Graphing exercise II: Name: ___________
- Making graphs from functions using a spreadsheet
-
- Graphing
 for
for
 :
Open up spreadsheet software such as Microsoft Excel or OpenOffice
Calc in the laboratory.
- In cell A1 enter x
- In cell B1 enter y
-
In cell A2 put -10
-
In cell A3 put -9
-
 Select the cells A2 to A3 by dragging across them:
- Click on the small black square in the lower right hand corner
(this is called the fill control).
-
While holding the mouse button down, drag down to A22.
- In B2 type: =(3* A2
/5)-3
-
Fill this formula down to B22 using the fill control.
-
Select both columns from A1 to B22.
-
 Click on the chart wizard in Excel
 or Calc
- Use the wizard and demonstrated in class to set up an x-y
scatter chart of the data.
-
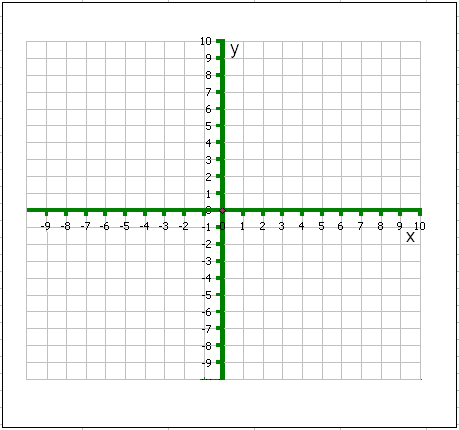
Copy the graph onto the blank graph further below.
-
Does it match the graph you made Tuesday?
-
Use a new blank sheet and graph
 for
for
 .
.
 In cell A1 enter x
- In cell B1 enter y
-
In cell A2 put -6
-
In cell A3 put -5.5
-
Drag down across the center of A2 and A3 and then use the fill
control to fill down to A26.
- Note that the exponentiation symbol ^ is obtained from
"shift-6".
-
In B2 type: =((A2^2)/2)-8
-
Fill this formula down to B26 using the fill control.
-
Make an x-y scatter chart of the data using the chart wizard.
-
Is the line a "smooth curve?"
-
Copy the graph onto the blank graph further below.
-
Does it match the graph you made Tuesday?
-
Use a new blank sheet and graph
 for
for
 with
an interval of 0.5 (fill down to A14) using the spreadsheet
function =((A2^3)/2)-2*A2
 -
Is the line a "smooth curve?"
-
Copy the graph onto the blank graph further below.
-
Does it match the graph you made Tuesday?

 Select the cells A2 to A3 by dragging across them:
 Click on the chart wizard in Excel
 In cell A1 enter x
 Select the cells A2 to A3 by dragging across them:
 Click on the chart wizard in Excel
 In cell A1 enter x
