Falling Spheres • Name:
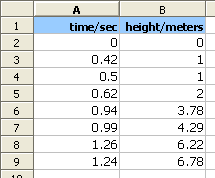
- Open the spreadsheet software Excel and enter the golf ball data from your data sheet. Your data will differ from that seen below, use your own data. The following data is provided only as an example of how to arrange the data in the spreadsheet.
- Use the chart wizard
 to make an xy graph of the data.
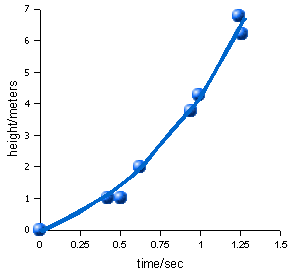
Note that the data suggests a non-linear relationship: there is a curvature to the data.
- Use a calculator to square the time data and only the time data.
- Enter the square of the time data and the original height data into a new table on your spreadsheet. The following uses the sample data above. You should use your own data.
| time²/sec² | height/meters |
|---|
| 0 | 0 |
| 0.18 | 1 |
| 0.25 | 1 |
| 0.38 | 2 |
| 0.88 | 3.78 |
| 0.98 | 4.29 |
| 1.59 | 6.22 |
| 1.54 | 6.78 |
- Graph the square of the time versus the height data.
- Does the graph look like a line or a curve? ______________
- Click on a data point in the graph. Choose Add Trendline from the Chart menu.
- Choose a linear line. Click on the options tab. Click on the Show equation. Click OK.
- Write down the equation:
y = _________ x + ___________
    Slope m       y-intercept b
Slope = __________________
Y-intercept b = ____________
- The above equation allows us to predict any height from a time squared:
height = slope m * time² + y-intercept
If the time is two seconds, from how high did the ball fall? ________
(Do not forget to square the time!)
If the time is four seconds, from how high did the ball fall? ________
- Two times the slope is the acceleration of gravity. Calculate the acceleration of gravity:
2 * slope = ____________
- We can work out the time for a ball to fall if given the height.
How long would it take the ball to fall 12 meters? ___________
How long would it take the ball to fall 24 meters? ___________
The highest point on Pohnpei is 760 meters. How long would it take the ball to fall 760 meters?
Homework
The following data was gathered for a falling golf ball:
| time/sec | height/meters |
|---|
| 0 | 0 |
| 1 | 5 |
| 2 | 20 |
| 3 | 45 |
| 4 | 80 |
- Graph the above data on the following graph:
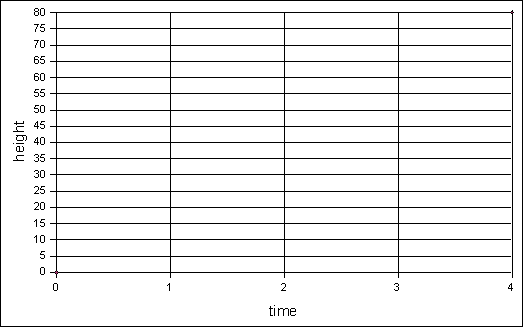
- What is the shape of the line on the graph above?
- Use a calculator to square the time data and fill in the results below:
| time²/sec² | height/meters |
|---|
| | 0 |
| (= x1) | 5 (= y1) |
| | 20 |
| | 45 |
| (= x2) | 80 (= y2) |
- Graph the above time² versus height data on the following graph:
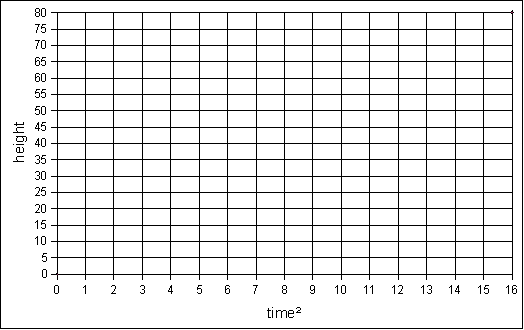
- Calculate the slope m from the equation m = (y2-y1)÷(x2-x1)
substituting the values from the table above for x1, x2, y1, and y2
- What does the y-intercept appear to be for this homework data? ________