For answers with units, do not forget to include the units
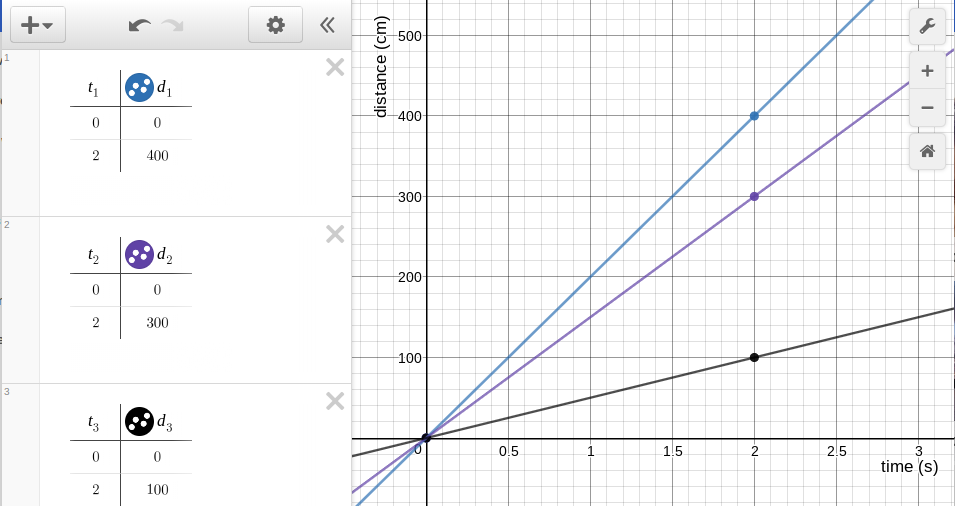
A RipStik moved at three different velocities (speeds). The data was gathered in the tables and plotted on the graph seen below.
__________ __________ Calculate the velocity (speed) for the first table (the top line).
__________ __________ Calculate the velocity (speed) for the second table (the middle line).
__________ __________ Calculate the velocity (speed) for the third table (the lowest line).
__________ Which RipStik run is the fastest: top, middle, or bottom line?
__________ Which RipStik run is the slowest: top, middle, or bottom line?
__________ __________ How far will the RipStik travel based on the velocity from the first table 36 seconds?
__________ __________ How long in seconds for the Ripstik to travel 5000 centimeters based on the data in the first table?
The five graphs seen below plot time versus distance for a rolling ball. Time in seconds is on the x-axis. Distance in centimeters is on the y-axis.
Explain what is happening with the speed of ball A.
Explain what is happening with the speed of ball B.
Explain what is happening with the speed of ball C.
Explain what is happening with the speed of ball D.
Explain what is happening with the speed of ball E.
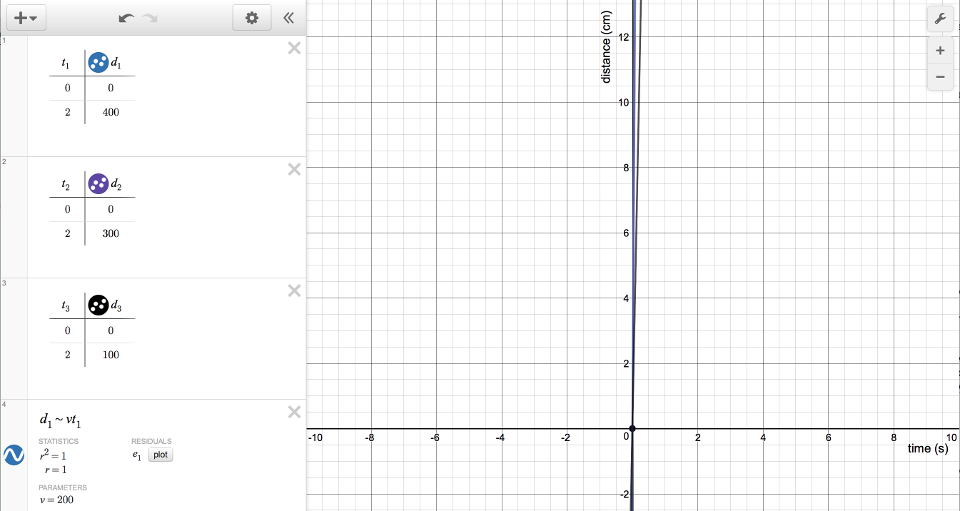
A student working in Desmos with data from lab two obtained the following chart. The student wanted to know why they cannot see their data, and why their lines are so close to the y-axis. What must the student do in Desmos to get the data to display on the chart?