The first graph plots data from a soap density measurement laboratory. The slope of the line is the density of the soap.
__________ Calculate the slope of the line.
______________ Determine the y-intercept of the line.
y = _________ x + __________ Write the y = mx + b slope-intercept equation for the line.
[float] or [sink] The slope of the line is the density of soap. If the density of the soap is less than one gram/centimeter³ then the soap would float. If the density of the soap is greater than one gram/centimeter³ then the soap would sink. Based on the above, will this soap float or sink?
A student gathered the data seen in the table below. Plot the data on the graph.
__________ Calculate the slope of the line.
__________ Calculate the intercept of the line.
__________ cm. How far will the RipStik travel in 23 seconds?
__________ seconds. How long in seconds for the RipStik to travel 7500 centimeters?
__________ What is the slope of the line y = 2.0 + 0.15x?
__________ What is the y-intercept of the line y = 2.0 + 0.15x?
_______________ What math class are you in? If you are not in math this term, what is the highest math class you took?
The graph shows soap density data. Use the graphed data to answer the following questions.
__________ _____ Calculate the density ρ of Dial Basic soap.
______________ Based on the density, will Dial Basic soap floatorsink?
__________ _____ Using the density of the Dial Basic soap, calculate the mass of a bar of Dial Basic soap that has a volume of 100 cm³.
__________ _____ Using the density the Dial Basic soap, calculate the volume of a bar of Dial Basic soap that has a mass of 250 grams.
__________ _____ Calculate the density ρ of Ivory soap.
______________ Based on the density, will Ivory soap floatorsink?
__________ _____ Calculate the density ρ of Neutrana soap.
Critical thinking: Based on the density, will Neutrana soap floatorsink?
A student gathered the data seen in the table below.
Plot the soap data on the graph.
__________ __________ Calculate the density of the soap. Include the units with your answer.
______________ Based on the slope, will this soap [float]OR[sink]?
______________ Based on the slope, is this soap likely to be [Ivory]OR[Dial] soap?
__________ __________ Calculate the mass for this soap for a volume of 200 cm³.
__________ __________ Calculate the volume for this soap for a mass of 240 g.
Critical thinking: Some laboratory groups obtained slopes which incorrectly predicted whether their soap would float or sink. Which are they more likely to have measured incorrectly and WHY: the volume or the mass?
The graph shows the time versus distance data gathered for four different ball speeds in laboratory 02.
__________ _____ Calculate the velocity ѵ of ball A.
__________ _____ Calculate the velocity ѵ of ball B.
__________ _____ Calculate the velocity ѵ of ball C.
__________ _____ Calculate the velocity ѵ of ball D.
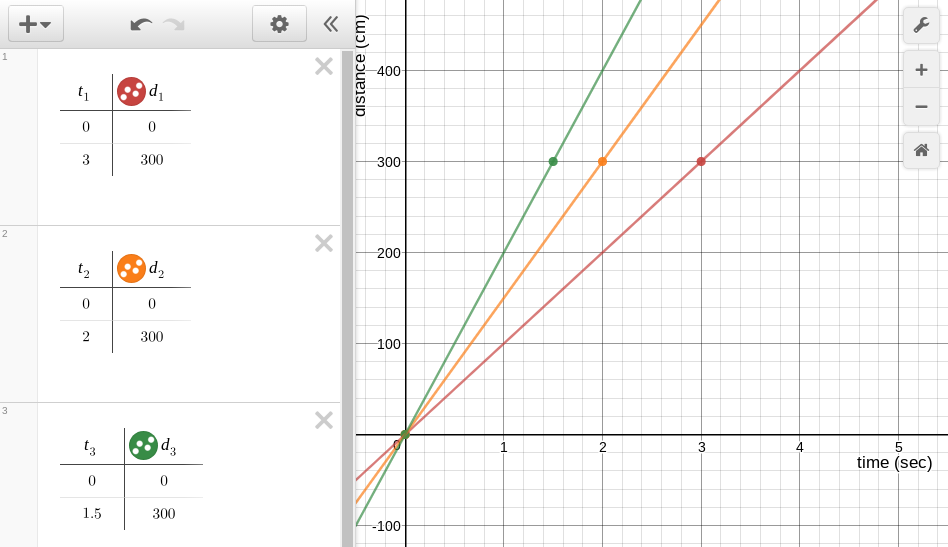
A RipStik moved at three different velocities (speeds). The data was gathered in the tables and plotted on the graph seen below.
__________ __________ Calculate the velocity (speed) for the first table (the lowest line).
__________ __________ Calculate the velocity (speed) for the second table (the middle line).
__________ __________ Calculate the velocity (speed) for the third table (the top line).
__________ Which RipStik run is the fastest: top, middle, or bottom line?
__________ Which RipStik run is the slowest: top, middle, or bottom line?
__________ __________ How far will the RipStik travel based on the velocity from the first table 36 seconds?
__________ __________ How long in seconds for the Ripstik to travel 5000 centimeters based on the data in the first table?
The five graphs seen below plot time versus distance for a rolling ball. Time in seconds is on the x-axis. Distance in centimeters is on the y-axis.
Explain what is happening with the speed of ball A.
Explain what is happening with the speed of ball B.
Explain what is happening with the speed of ball C.
Explain what is happening with the speed of ball D.
Explain what is happening with the speed of ball E.
Critical thinking: In the RipStik run my velocity varied by small amounts as I moved down the sidewalk. What suggestions do you have for how I might keep a steady velocity?
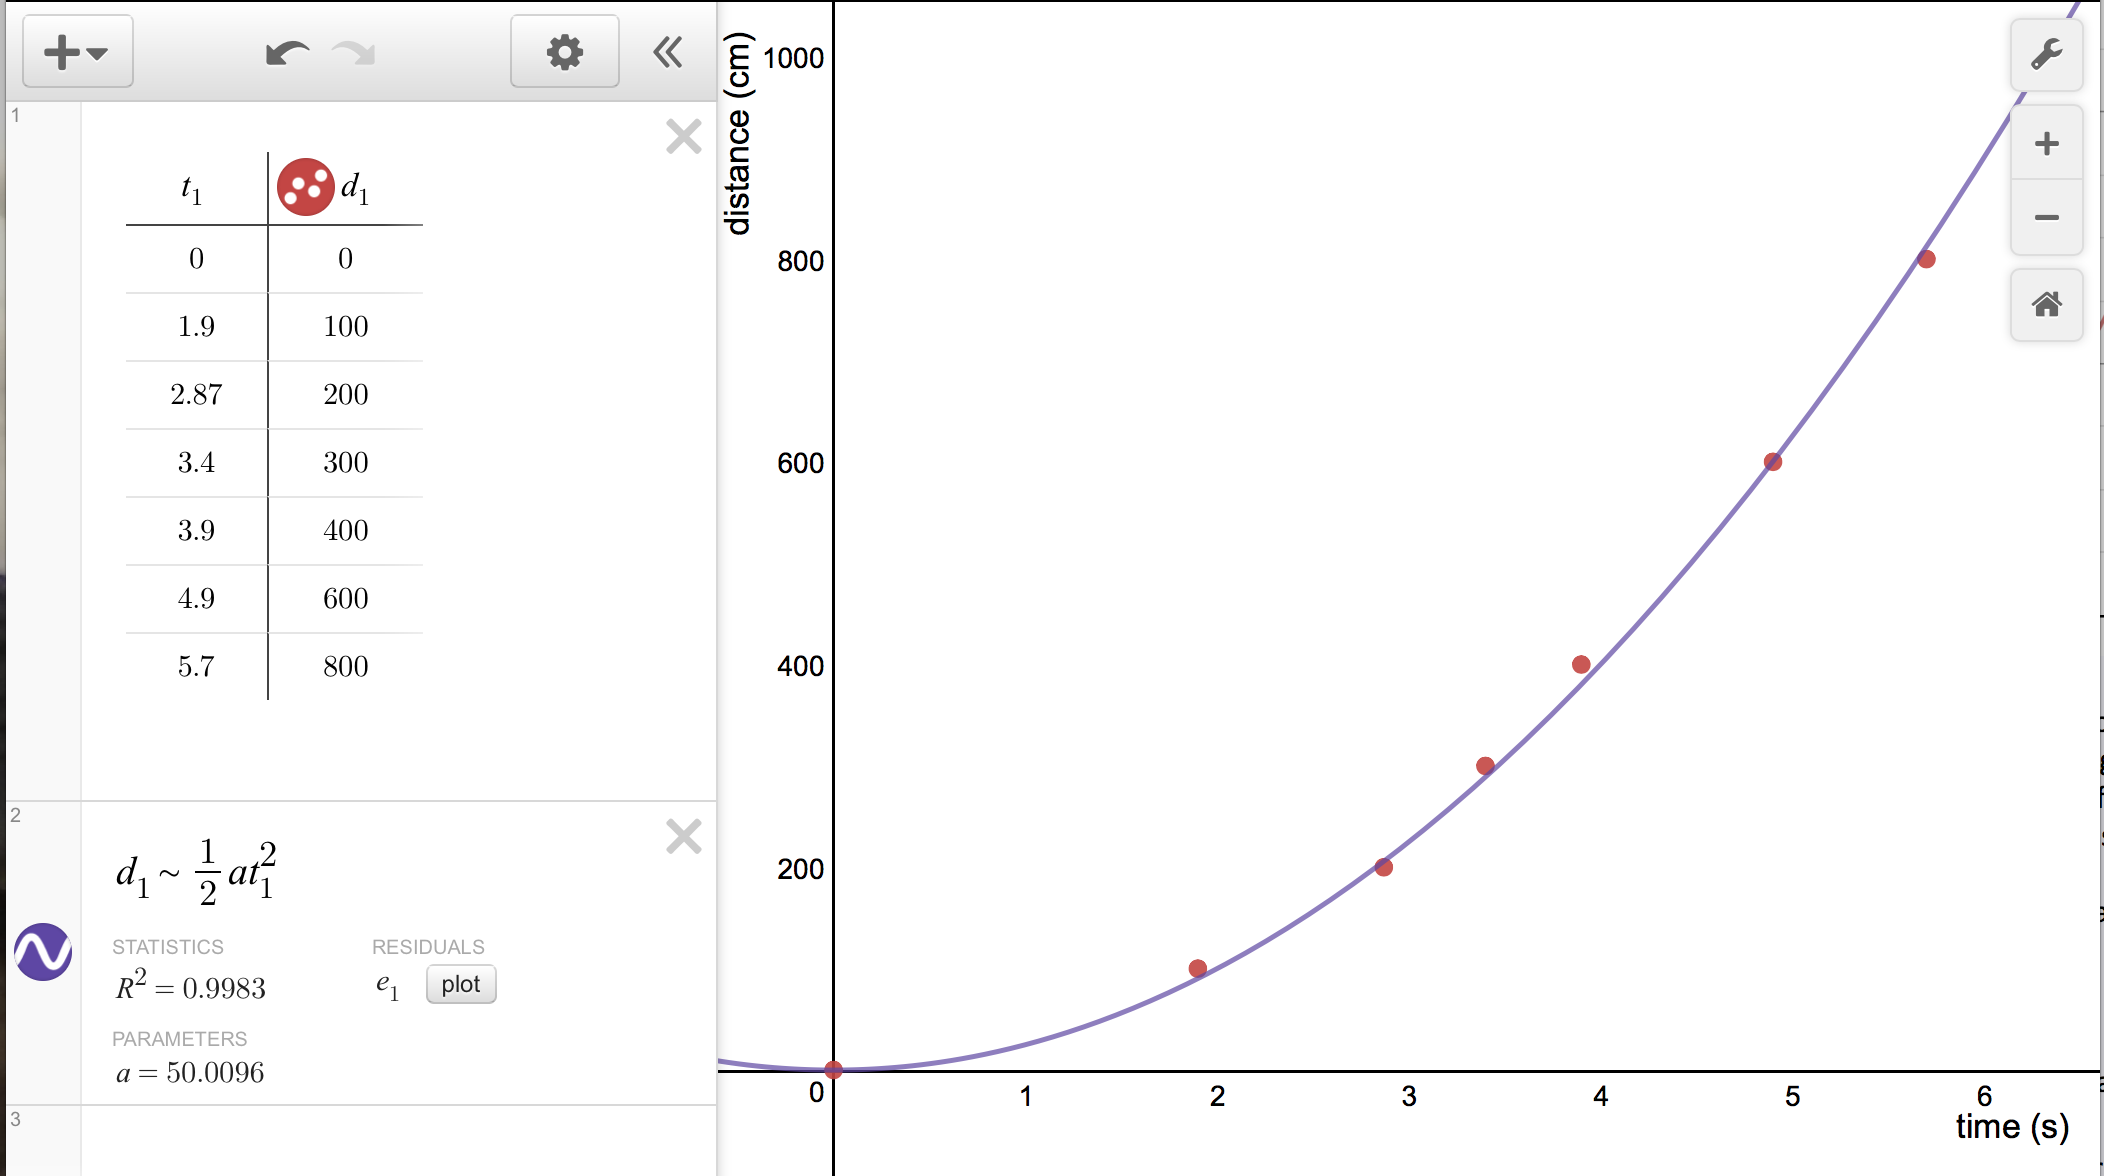
For the Desmos graph and regression, determine the acceleration of the RipStik from a Monday run. Times are in seconds, distances in centimeters.
acceleration: __________ __________
__________ __________ If the RipStik continued to accelerate at the rate above, how far will the RipStik travel in 30 seconds?
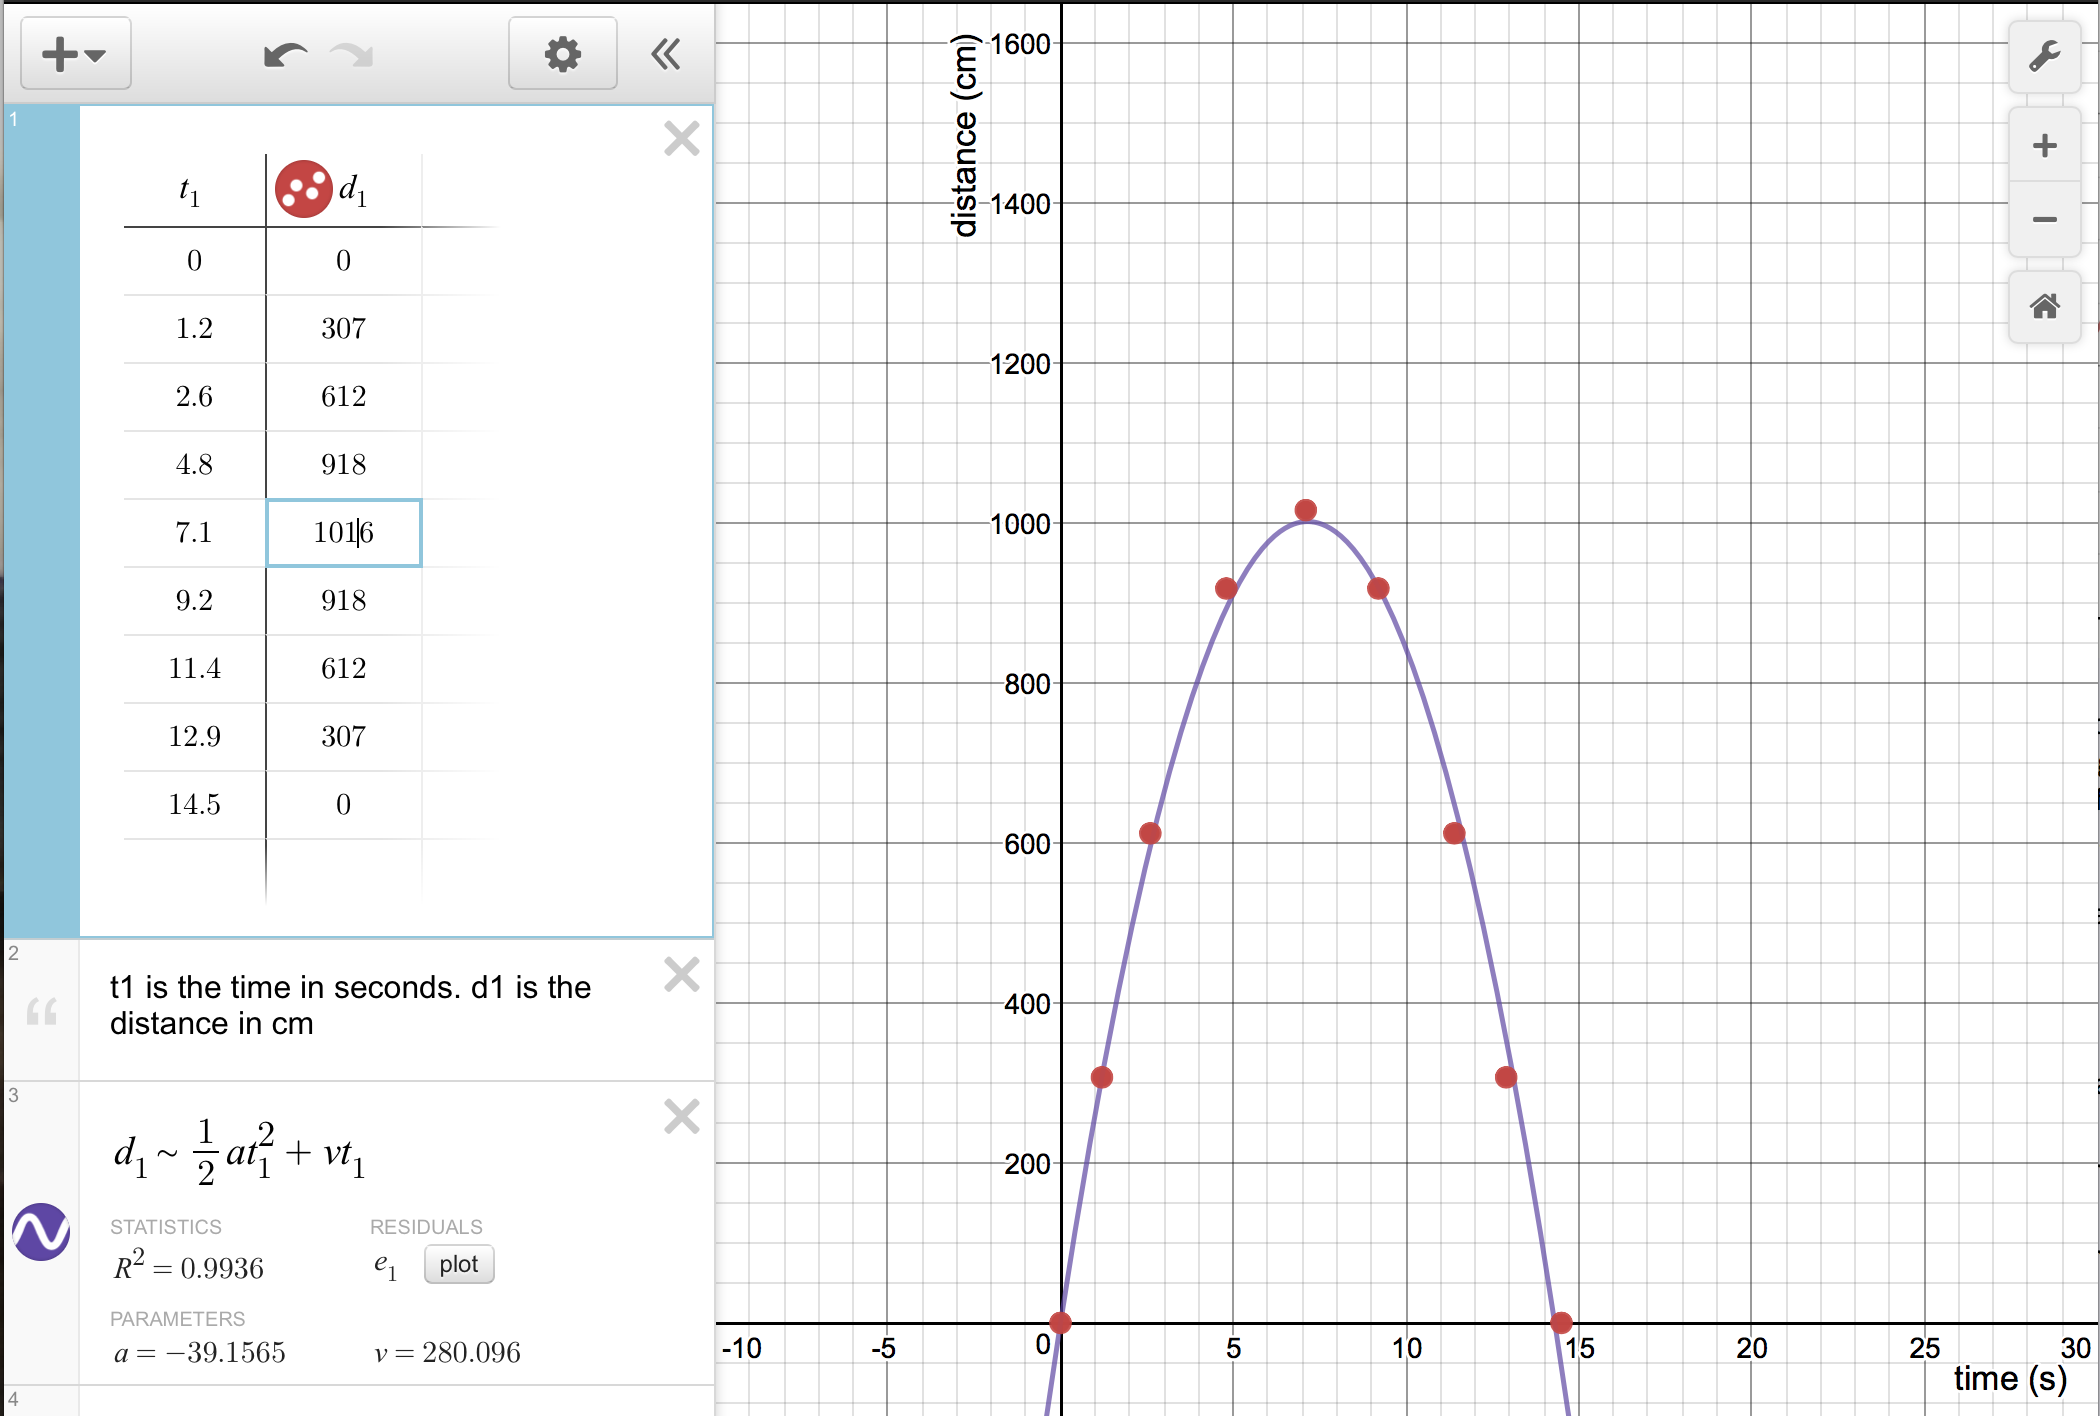
For the Desmos graph and regression, determine the acceleration and initial velocity of the RipStik from a Wednesday run. Times are in seconds, distances in centimeters.
acceleration: __________ __________
initial velocity: __________ __________
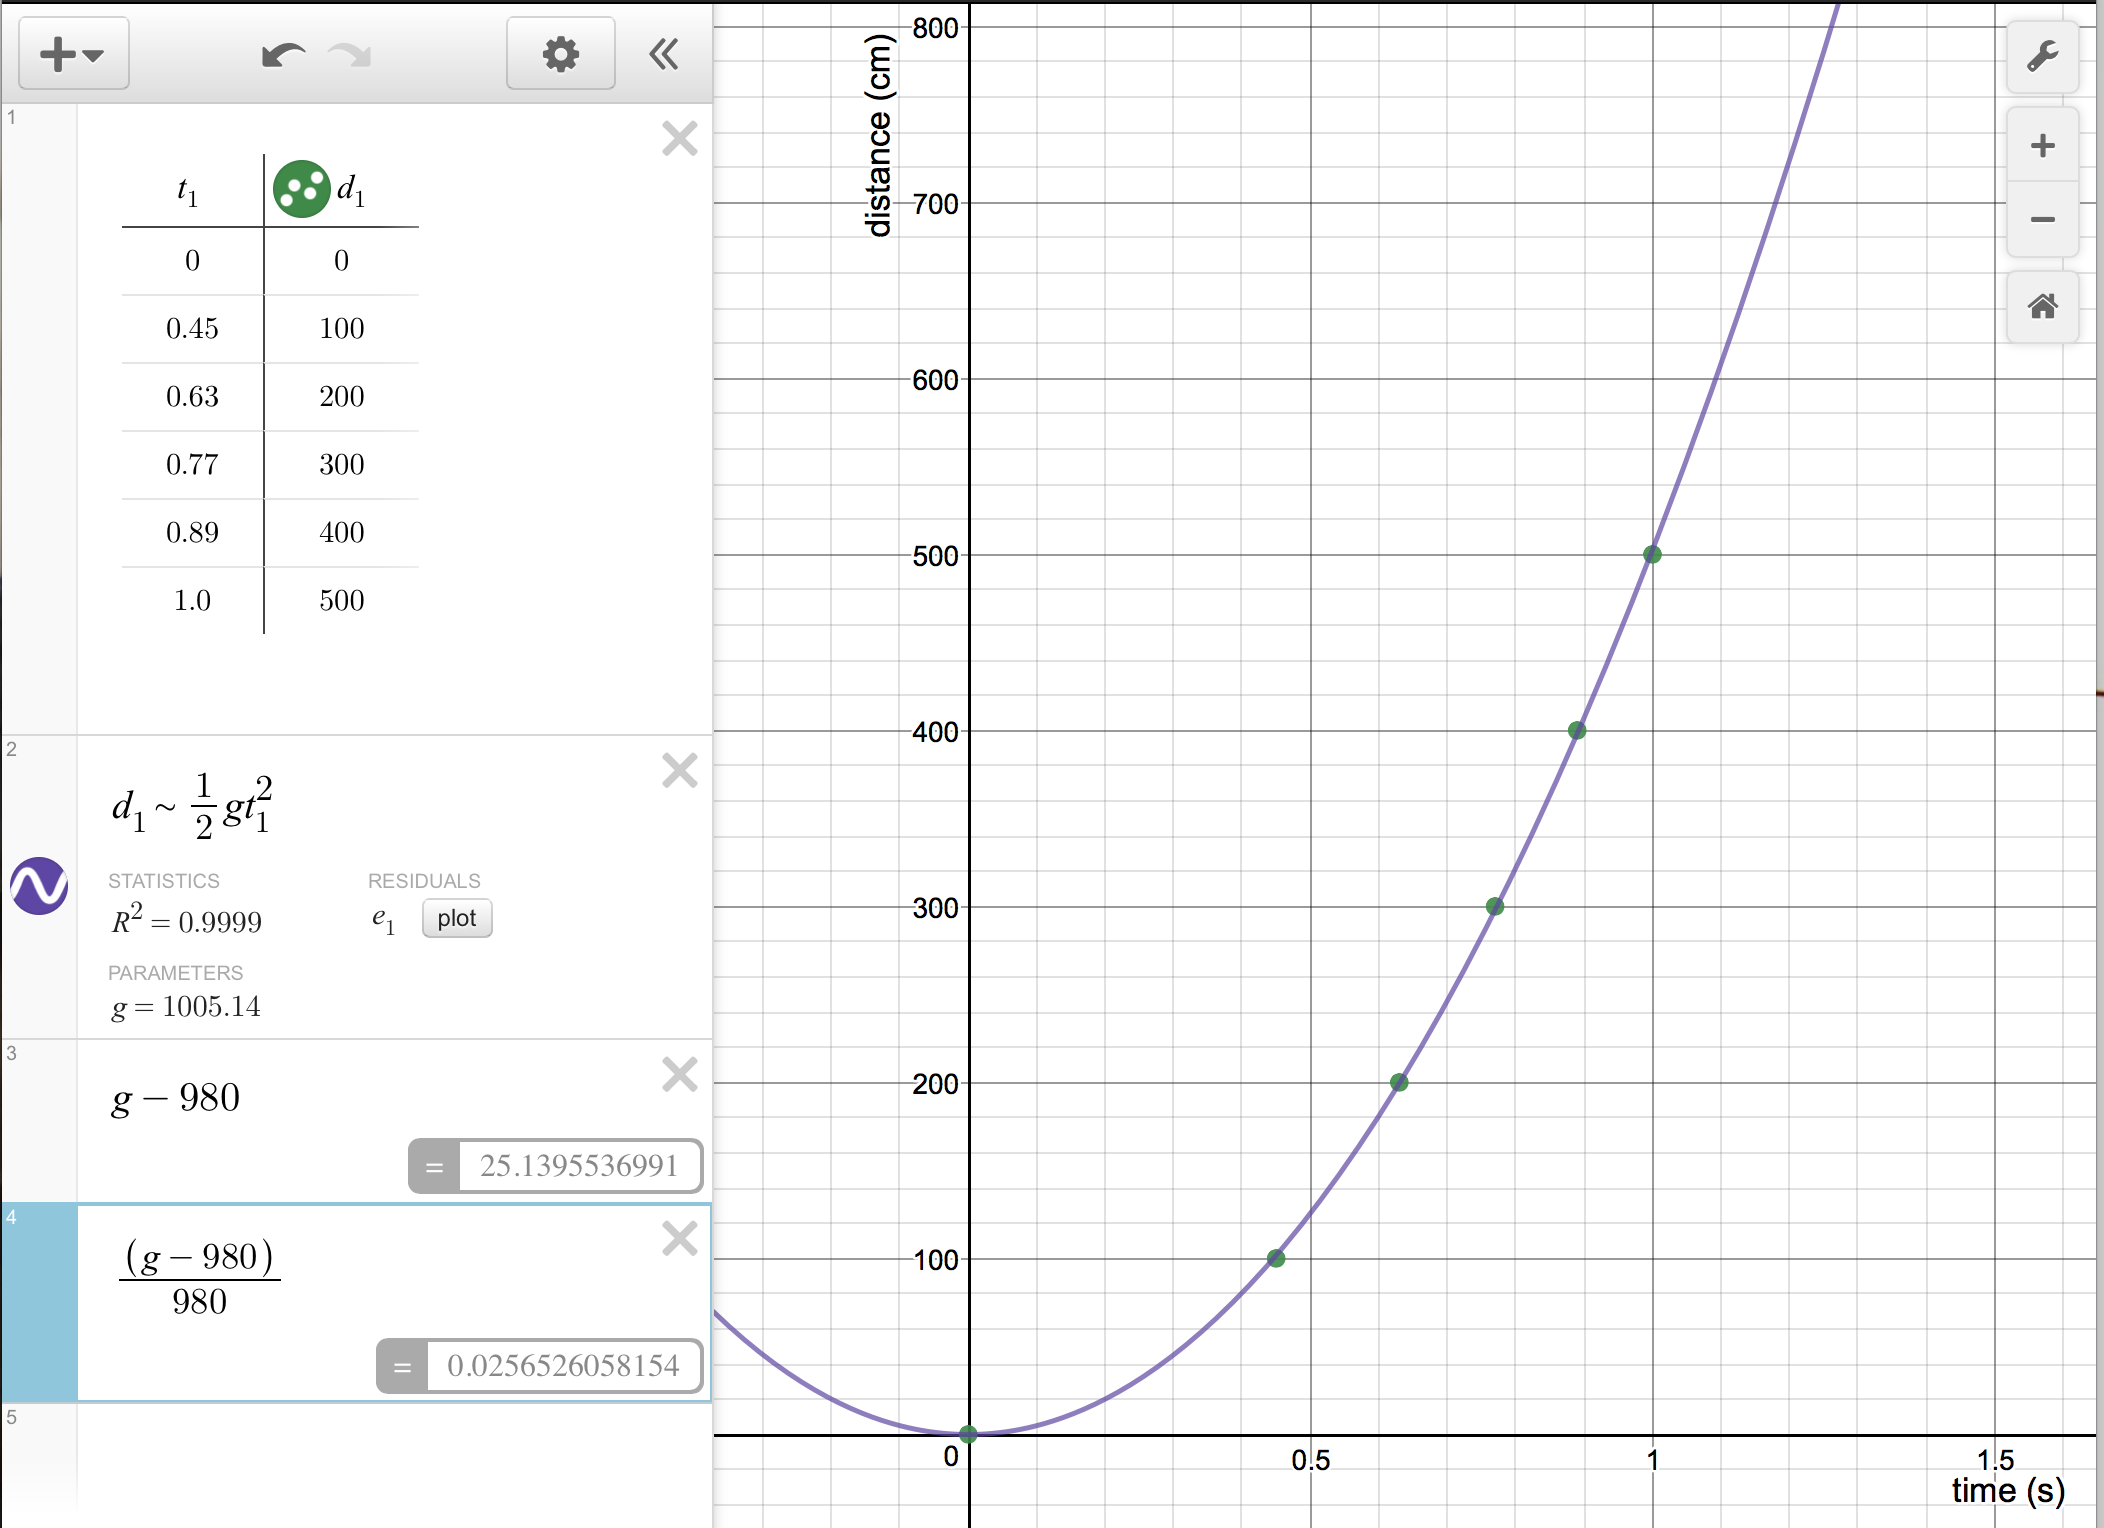
For the Desmos graph and regression, determine the acceleration of gravity from a Thursday laboratory. Times are in seconds, distances in centimeters.
acceleration of gravity: __________ __________
__________ __________ What is the raw error with respect to the published value of 980 cm/s²?
________________ What is the percent error?
______________________ How good is the agreement of the experimental value to the published value?
__________ __________ If the ball continued to fall and accelerate at the rate above, how far will the ball travel in 30 seconds?
When a RipStik rolls down hill...
☐ The RipStik rolls at a constant rate of speed.
☐ The RipStik rolls less than twice as fast from twice as high.
☐ The RipStik rolls twice as fast from twice as high.
☐ The RipStik rolls more than twice as fast from twice as high.
The chart below has three height versus distance functions plotted, each labelled by a letter: A, B, or C. Match the function by letter to the description below.
___ With increasing height, the velocity increases at an increasing rate.
___ With increasing height, the velocity increases at a constant rate.
___ With increasing height, the velocity increases at a decreasing rate.
___ Which of these functions depicts what really happened on Monday: A, B, or C?
My Corona EXiV car has a mass of 1150 kg. Driving at the state speed limit of 11.1 m/s (that is forty kilometers per hour), calculate the following:
__________ __________ ...the momentum p of the car.
__________ __________ ...the kinetic energy KE of the car.
A marble with a mass of 5.0 grams is 40 centimeters above a table on a banana leaf marble ramp. The marble is released and rolls down the ramp onto the table. Use an acceleration of gravity g equal to 980 cm/s² for this question.
__________ __________ Calculate the Gravitational Potential Energy of the marble before the marble is released.
__________ __________ Determine the Kinetic Energy that the marble should have at the bottom of the ramp.
__________ __________ Calculate the velocity that the marble should have at the bottom of the ramp.
__________ In the laboratory using an actual marble and banana leaf, will the marble have the speed you just calculated?
__________ Will the actual marble be fasterORslower?
Why?
A student rolled marbles into a line of five marbles.
What happens when one marble is rolled into five marbles on a ruler track?
What happens when two marbles are rolled into five marbles on a ruler track?
How is the number of marbles rolling into a line of marbles related to the number rolling out of a line of marbles?
What happens when the number of marbles rolling into a line of marbles on the ruler track is greater than the number marbles in that line of marbles on the ruler? For example, what happen when six marbles roll into four marbles?
What happens when the marble(s) roll into a line of marbles slowly? Slow in...
What happen when the marble(s) roll into a line of marbles quickly? Fast in...
Does marble speed inbound affect marble number outbound? That is, does speed affect number?
Explain why you think the marbles know what to do.
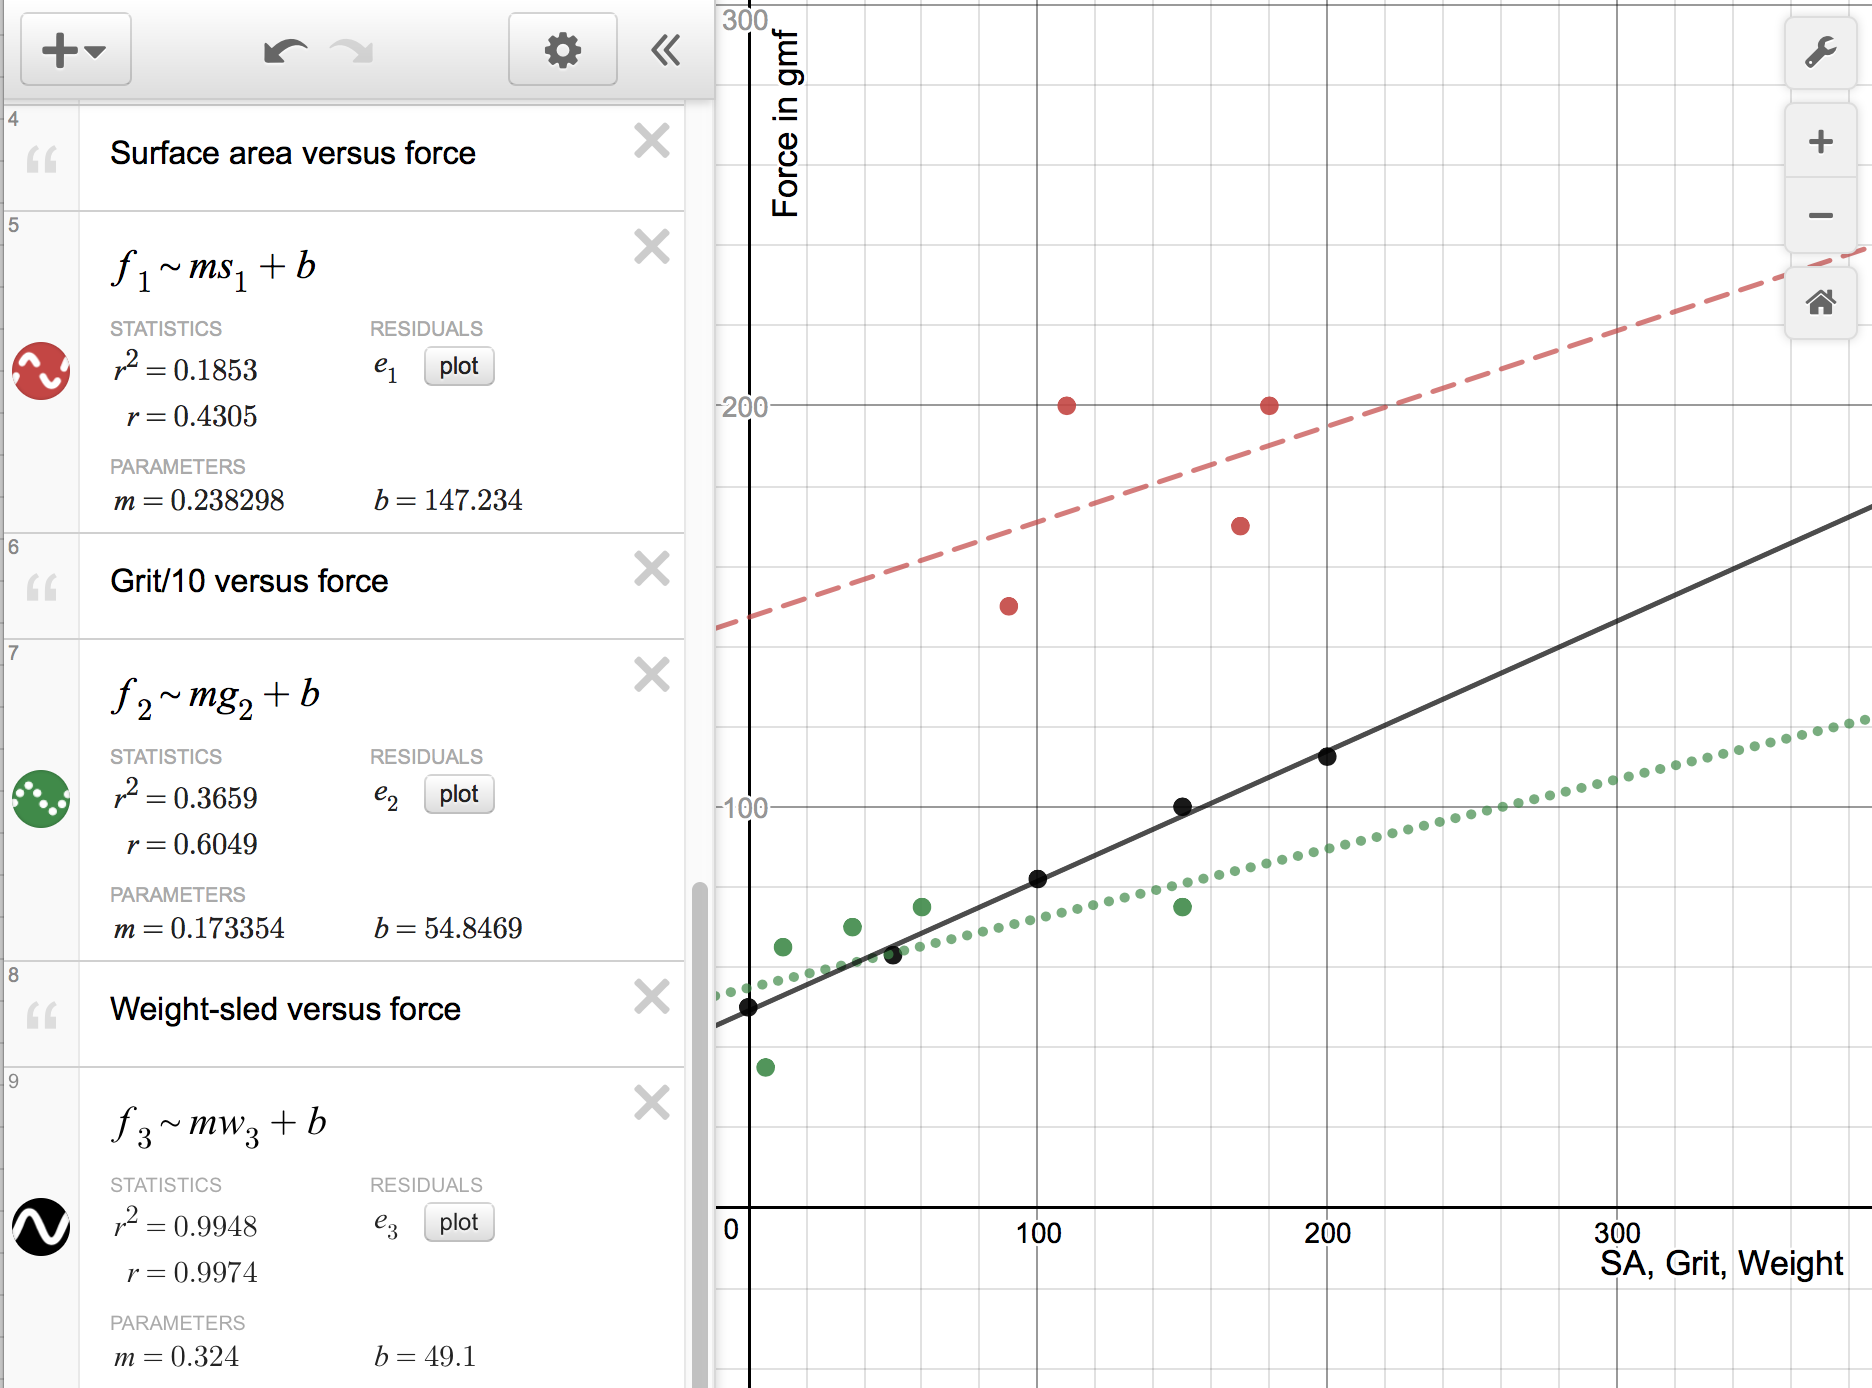
The graph show force of friction data for weight, grit, and surface area.
_______________ Based on the data above, which variable has the most effect on the force of friction?
Why?
_______________ Based on the data above, which variable has the least effect on the force of friction?
Why?
Provide definitions for the following:
Newton's first law of motion.
Newton's second law of motion.
Newton's third law of motion.
List the three ways heat energy moves:
Temperatures in Celsius:
_________℃ What is the temperature of a mix of melting ice and water?
_________℃ What is the temperature at which solidified coconut oil melts?
_________℃ What is the typical indoor temperature in Pohnpei?
_________℃ What is the temperature of the healthy living human body?
_________℃ What is the temperature of boiling water?
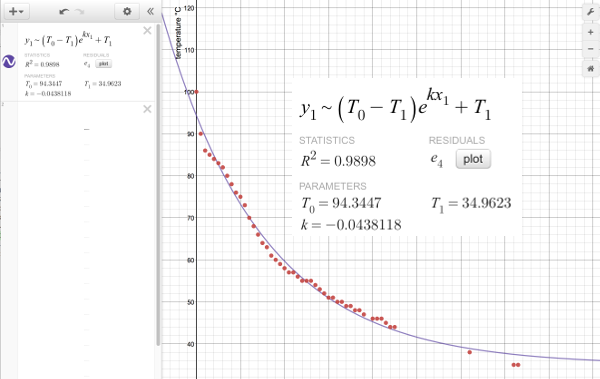
The graph shows cooling curve data from laboratory six.
T0 = _______________ Based on the analysis, what was the mathematically predicted starting temperature T0?
T1 = _______________ Based on the analysis, what is was the mathematically predicted final temperature T1?
k = _______________ Based on the analysis, what is the rate of decay k?
A student gathered the data seen in the table below.
Plot the soap data on the graph.
__________ __________ Calculate the density of the soap. Include the units with your answer.
______________ Based on the slope, will this soap [float]OR[sink]?
______________ Based on the slope, is this soap likely to be [Ivory]OR[Dial] soap?
__________ __________ Calculate the mass for this soap for a volume of 200 cm³.
__________ __________ Calculate the volume for this soap for a mass of 240 g.
Provide definitions for the following:
Newton's first law of motion.
Newton's second law of motion.
Newton's third law of motion.
A student rolled marbles into a line of five marbles.
What law of physics is being demonstrated by the marbles on the marble ramp?
A RipStik moved at three different velocities (speeds). The data was gathered in the tables and plotted on the graph seen below.
__________ __________ Calculate the velocity (speed) for the first table (the lowest line).
__________ __________ Calculate the velocity (speed) for the second table (the middle line).
__________ __________ Calculate the velocity (speed) for the third table (the top line).
__________ Which RipStik run is the fastest: top, middle, or bottom line?
__________ Which RipStik run is the slowest: top, middle, or bottom line?
__________ __________ How far will the RipStik travel based on the velocity from the first table 36 seconds?
__________ __________ How long in seconds for the Ripstik to travel 5000 centimeters based on the data in the first table?
For the Desmos graph and regression, determine the acceleration and initial velocity of the RipStik from a Wednesday run. Times are in seconds, distances in centimeters.
acceleration: __________ __________
initial velocity: __________ __________
__________ __________ After six seconds, what is the distance of the RipStik?
__________ __________ After thirty seconds, what is the distance of the RipStik?
A marble with a mass of 5.0 grams is 20 centimeters above a table on an orange plastic track. The marble is released and rolls down the ramp onto the table. Use an acceleration of gravity g equal to 980 cm/s² for this question.
__________ __________ Calculate the Gravitational Potential Energy of the marble before the marble is released using the formula GPE = mgh.
__________ __________ The kinetic energy at the bottom of the ramp should be equal to the GPE the marble had at the top of the ramp. Solving Kinetic Energy KE = ½mѵ² for ѵ, calculate the velocity that the marble should have at the bottom of the ramp.
__________ In the laboratory using an actual marble and the orange track, will the marble have the speed you just calculated?
__________ Will the actual marble speed be fasterORslower than you have calculated?
_______________which variable had the most effect on the force of friction?
Do hot objects cool off linearily and, if not, how do hot objects cool?
Temperatures in Celsius:
_________℃ What is the temperature of a mix of melting ice and water?
_________℃ What is the temperature at which solidified coconut oil melts?
_________℃ What is the typical indoor temperature in Pohnpei?
_________℃ What is the temperature of the healthy living human body?
_________℃ What is the temperature of boiling water?
On Wednesday you started the search for Lee Ling at the south faculty office, E 158° 09.612'.
_________ _____ Lee Ling was at E 158° 09.314'. Calculate the difference in arcminutes between the south faculty office and Lee Ling.
_________ _____Use the difference in arc minutes from part a) and the experimental value of 1850 meters per arcminute of longitude here on Pohnpei to calculate the distance in meters you had to walk to the East to get to Lee Ling's location.
___________________ If you were to travel straight East from Pohnpei to the prime meridian, what country would you be in when you reached the prime meridian?
___________________ Which way is the equator from here on campus, towards Kitti or towards Kolonia?
☁: ________________________
☁: ________________________
☁: ________________________
What is the difference between weather and climate?
Explain what happens to sea surface temperatures in the western Pacific during an El Niño.
Explain what happens to precipitation in the western Pacific during an El Niño.
Explain what happens to sea surface temperatures in the western Pacific during an La Niña.
Explain what happens to precipitation in the western Pacific during an La Niña.
What is the current ENSO state: El Niño, La Niña, or ENSO neutral?
With respect to storms in the western Pacific, what is the "El Niño, box"?
A wave was inscribed on poster paper by a RipStik.
On the diagram above, label a crest.
On the diagram above, label a trough.
λ = _________ _________ What is the wavelength λ of ONE wave?
a = _________ _________ What is the amplitude a?
τ = _________ _________ As seen in the diagram, the RipStik took 1.45 seconds to swizzle (wiggle) 2.5 times. What is the period τ of ONE wave?
f = _________ _________ What is the frequency f of the RipStik wave?
ѵwave = _________ _________ What is the wave velocity ѵwave?
A ball bounces 40 times in 10 seconds.
τ = _________ _________What is the period of the bouncing ball?
f = _________ _________ What is the frequency for the bouncing ball?
During laboratory nine, the measuring of the speed of sound, students out at 400 meters heard the clap 1.11 seconds after they saw the boards collide .
velocity ѵ = _________ _________ Based only on that measurement, what was the experimental speed of sound?
raw error = _________ _________ Given that the actual speed of sound that day was 350 m/s, what is the raw error?
% error = _____________ Given that the actual speed of sound that day was 350 m/s, what is the percentage error?
☁: ________________________
☁: ________________________
☁: ________________________
Write out the full names of the seven colors of the Newtonian rainbow IN ORDER:
Kestrels (a type of hawk related to falcons) use light to determine if a field has voles (related to mice) in a field. What is the name of the type of light the kestrel is using and how are they using that light?
Explain why a cup of coffee is bright white in an image taken with an infra-red camera.
List the three primary colors of light:
List the three secondary colors of light:
Hue Saturation Luminosity (HSL) colors:
Define Hue:
Define Saturation:
Define Luminosity:
Explain why the yellow you see on a computer monitor or a smartphone screen is called "fake yellow"
List the three colors the cones in the eye can detect:
Explain why pink can be considered "minus green"
☁: ________________________
☁: ________________________
☁: ________________________
Define reflection.
Define refraction.
Define total internal reflection.
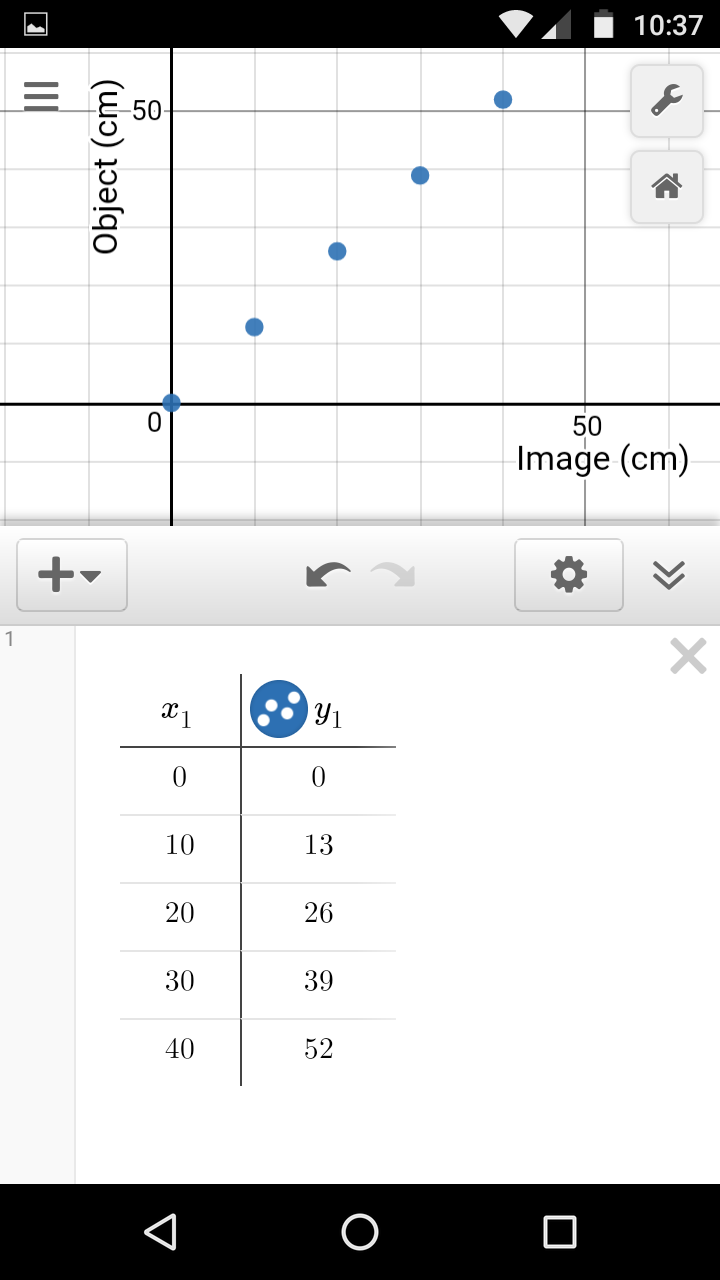
__________ Based on the image at the right, what is the index of refraction for water?
A student gathered the data seen in the table seen further below.
______________ Calculate the slope of the line. The slope is the experimental index of refraction for water.
______________ __________ Use the slope above to predict the object depth for a penny that appears to be 30 cm underwater.
______________ __________ Use the slope above to predict the image depth for a coral head that is 200 cm underwater.
______________ Water has a published index of refraction of 1.33. What is the error for the slope?
______________ Water has a published index of refraction of 1.33. What is the percentage error for the slope?
☁: ________________________
☁: ________________________
☁: ________________________
From the video "Power comes in many forms" give three examples of different forms power can come in - what are three alternatives from the video?
A Whirlpool dryer uses 26 amps of current at 240 volts.
__________ _____ Given that V = iR, calculate the resistance R for the dryer.
__________ _____ Given that P = iV, calculate the power P for the dryer.
__________ Power is now about forty cents per kiloWatt hour, or $0.40 for 1000 Watts for one hour. How much does it cost to run the dryer for one hour?
__________ What is the atomic number of Zn?
__________ What is the atomic mass of Zn?
__________ How many protons does Zn have?
__________ How many neutrons does Zn have?
__________ How many electrons does Zn have?
[Note that in an atom the number of neutrons is equal to or greater than the number of protons. Thus the more numerous nucleons are the neutrons.]
_______________ Looking only at the atomic diagram on this paper, determine the atomic number of the atom depicted.
_______________ Looking at the diagram, what is the atomic mass for the atom?
_______________ Looking at the diagram and the chart on the wall, what is the one or two letter chemical abbreviation for this element?
_______________ What is the common name for compound with the formula H2O?
_______________ In general, what color do acids tend to turn floral pigment fluids?
_______________ In general, what color do bases tend to turn floral pigment fluids?
_______________ Are lime fruits acid, base, or neutral?
_______________ Is vinegar an acid, base, or neutral?
_______________ Is cream of tartar an acid, base, or neutral?
_______________ Is water an acid, base, or neutral?
_______________ Is baking soda an acid, base, or neutral?
_______________ Is ammonia an acid, base, or neutral?
_______________ Is a bar of hand soap an acid, base, or neutral?
_______________ Is laundry detergent an acid, base, or neutral?
_______________ Is bleach an acid, base, or neutral?
Fill in the blanks:
The title of the movie that we watched on Monday was "The Journey to the Edge of the Universe". The journey begins with a "single step". A single step up, just 60 miles up, and we leave the atmosphere of the Earth. Dozens of astronauts have come before us, twelve of those astronauts walked on Earth's nearest satellite, the ___ ___ ___ ___. This video also showed Neil Armstrong's footprints, which may survive million of years maybe longer than us.
The movie then journeyed to the planet nearest to the Earth, ___ ___ ___ ___ ___. This planet is also called Morning Star, the Evening Star, and a sister to our planet Earth.It is about the same size of our Earth. The clouds are made up sulphuric acid with carbon dioxide. This is one angry Goddess, the air is noxious, unbearable, and hot, approaching 900 degrees. The narrator mention that there is nothing can survive on the planet
The second planet the movie visited was ___ ___ ___ ___ ___ ___ ___. This is a rocky planet with no atmosphere, with the result being that the temperature swings wildly between 800 degrees Fahrenheit during the day and -275 degrees Fahrenheit at night. The core of the planet is a large iron core.
The movie then visited the ___ ___ ___, the star at the center of the solar system, a giant sphere of hydrogen and helium, a nuclear fusion furnace.
The third planet visited was ___ ___ ___ ___ . This planet is the fourth planet from the center of the solar system and is also called the red planet. The planet is red and dead. There is wind and where there is wind then there is air. No ozone layer, nothing to protect any creatures who might choose to live there from deadly space radiation. If they have any creatures. It is hard to believe anything could live here because of the kinds of weather that they have. There was also this the largest volcano in the solar system, Olympus Mons, taller than Mount Everest.
Between the red planet the largest planet in the solar system is the ___ ___ ___ ___ ___ ___ ___ __ belt. In the video on Monday and again on Wednesday we met a dwarf planet in this belt, ___ ___ ___ ___ ___.
The largest planet in the solar system is the gas giant ___ ___ ___ ___ ___ ___ ___. A giant red spot can be seen, a vast cyclonic storm larger than the planet earth.
Beyond the largest planet is the "ringed planet," ___ ___ ___ ___ ___ ___. This planet is also a gas giant.
The ringed planet has a moon called ___ ___ ___ ___ ___. There was so much to see in this planet. There is an atmosphere. There is wind, "rain", many different seasons, rivers, lakes, and oceans, that looks familiar and similar to our own planet which is Earth. And yet they are completely different: rives, lakes, and oceans of liquid methane, natural gas, an atmosphere with nitrogen but no oxygen. There is no way life can develop in on this moon of the ringed planet.
Beyond the ringed planet is a planet unknown to the ancients, the planet ___ ___ ___ ___ ___ ___. This is the first planet to be discovered using a telescope. The planet is tipped over at a 98 degree angle, the north pole now facing the sun. 42 years of sunlight will strike the north pole until the sun sets as the planet moves around the sun.
The next planet out is named for the Roman god of the sea, ___ ___ ___ ___ ___ ___ ___. This planet is also a gas giant, but not as large as the largest planet nor the ringed planet. The planet is covered in hydrogen, helium, and methane gas. The planet has very high wind speeds. High winds speeds means that the atmosphere has a lot of kinetic energy. But the planet is too far from the sun for the sun to be the source of the energy. Something else is creating the wind.
Beyond this last planet there are no more "full size" planets. The dwarf planet ___ ___ ___ ___ ___ used to be the "ninth planet" but was demoted and is now called a dwarf planet. The surface appears to be frozen water ice and carbon compounds.
If the sun is the size of a small ball as on the board Wednesday, where is Pluto located and how big is Pluto?
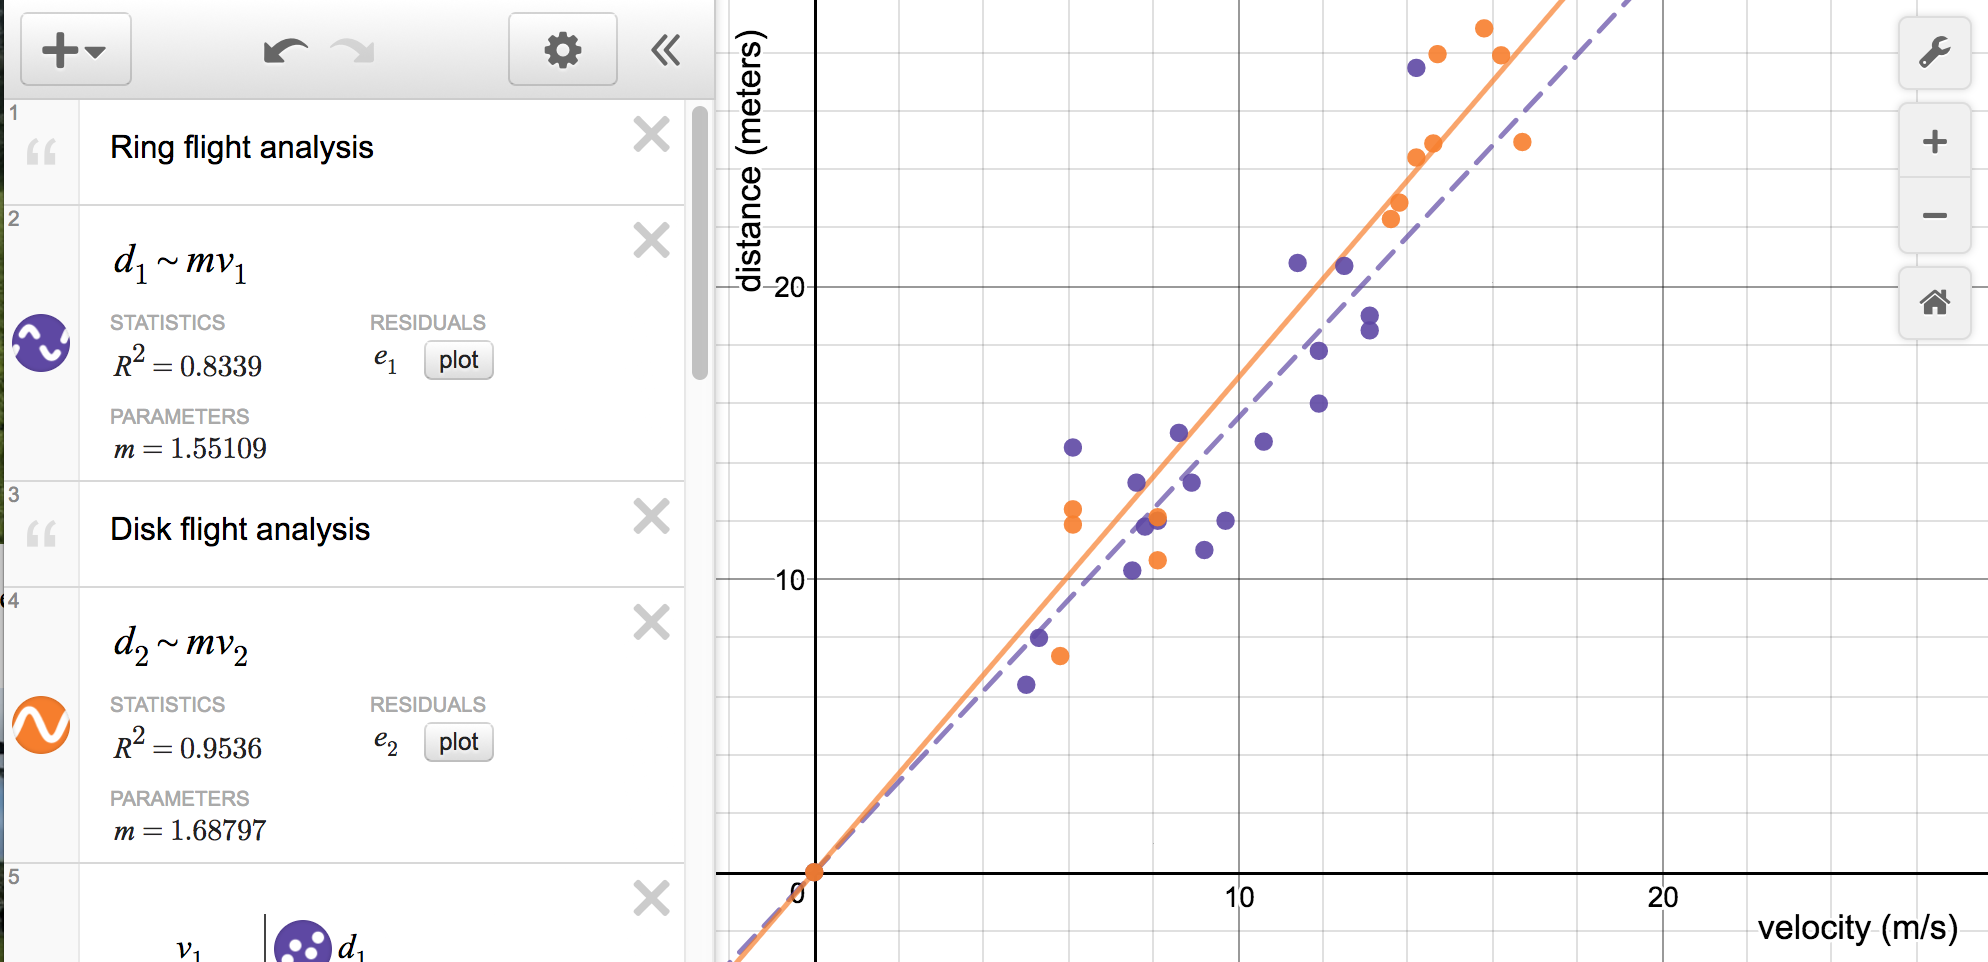
In the following Desmos graph v1 and d1 are for a flying ring. v2 and d2 are for a flying disk. Does either object fly "better" than the other? If yes, then which one flies "better" and why? If no, then why "no"?
point-slope form:
raw error = experimental value − expected value
distance d = velocity ѵ × time t
ѵ = at ѵ = gt d = ½at² d = ½gt²
where g is the acceleration of gravity g = 980 cm/s²
Gravitational Potential Energy GPE = mgh
Kinetic Energy KE = ½mѵ²
momentum p = mass m × velocity ѵ
Force F = mass m × acceleration a
period τ = 1 ÷ (frequency f)
frequency f = 1 ÷ (period τ )
velocity ѵ = wavelength λ × frequency f
Voltage V = current i * resistance R
Power P = iV
 ☁: ________________________