- The graph show force of friction data for weight, grit, and surface area.
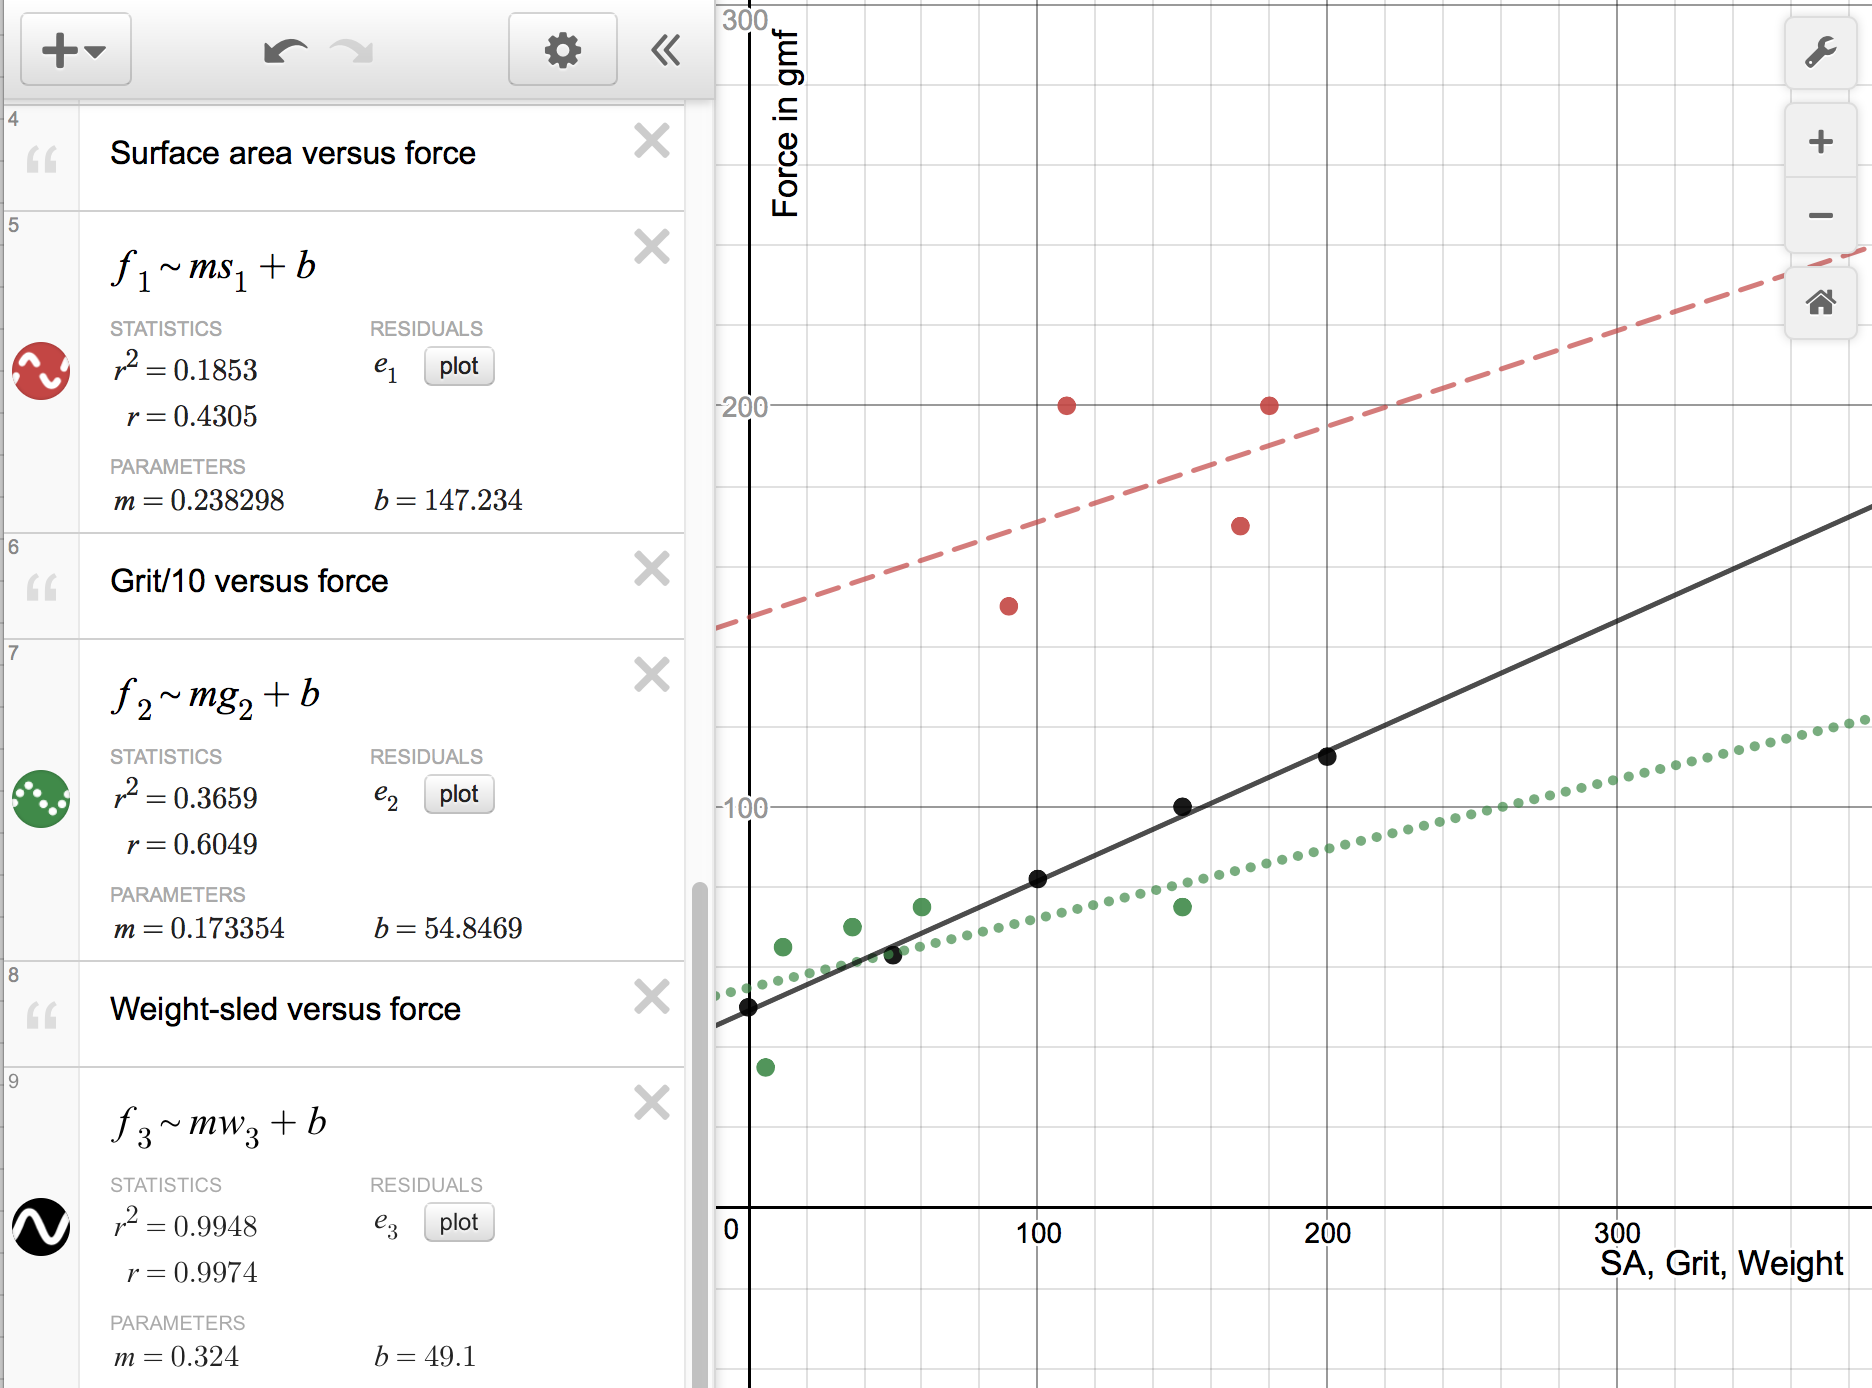
- _______________ Based on the data above, which variable has the most effect on the force of friction?
Why?
- _______________ Based on the data above, which variable has the least effect on the force of friction?
Why?
- Provide definitions for the following:
- Newton's first law of motion.
- Newton's second law of motion.
- Newton's third law of motion.
- List the three ways heat energy moves:
- Temperatures in Celsius:
- _________℃ What is the temperature of a mix of melting ice and water?
- _________℃ What is the temperature at which solidified coconut oil melts?
- _________℃ What is the typical indoor temperature in Pohnpei?
- _________℃ What is the temperature of the healthy living human body?
- _________℃ What is the temperature of boiling water?
- The graph shows cooling curve data from laboratory six.
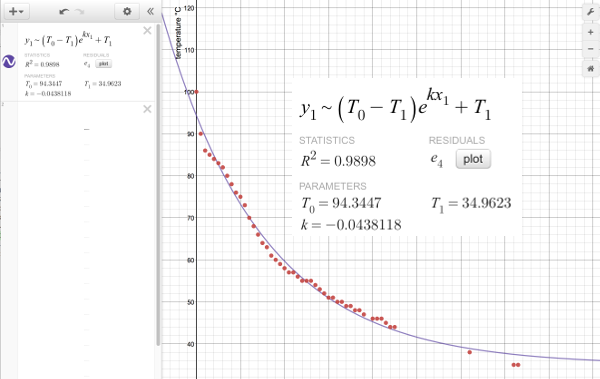
- T0 = _______________ Based on the analysis, what was the mathematically predicted starting temperature T0?
- T1 = _______________ Based on the analysis, what is was the mathematically predicted final temperature T1?
- k = _______________ Based on the analysis, what is the rate of decay k?