- __________ Calculate the slope of the line.
- ______________ Determine the y-intercept of the line.
- y = _________ x + __________ Write the y = mx + b slope-intercept equation for the line.
- [float] or [sink] The slope of the line is the density of soap. If the density of the soap is less than one gram/centimeter³ then the soap would float. If the density of the soap is greater than one gram/centimeter³ then the soap would sink. Based on the above, will this soap float or sink?
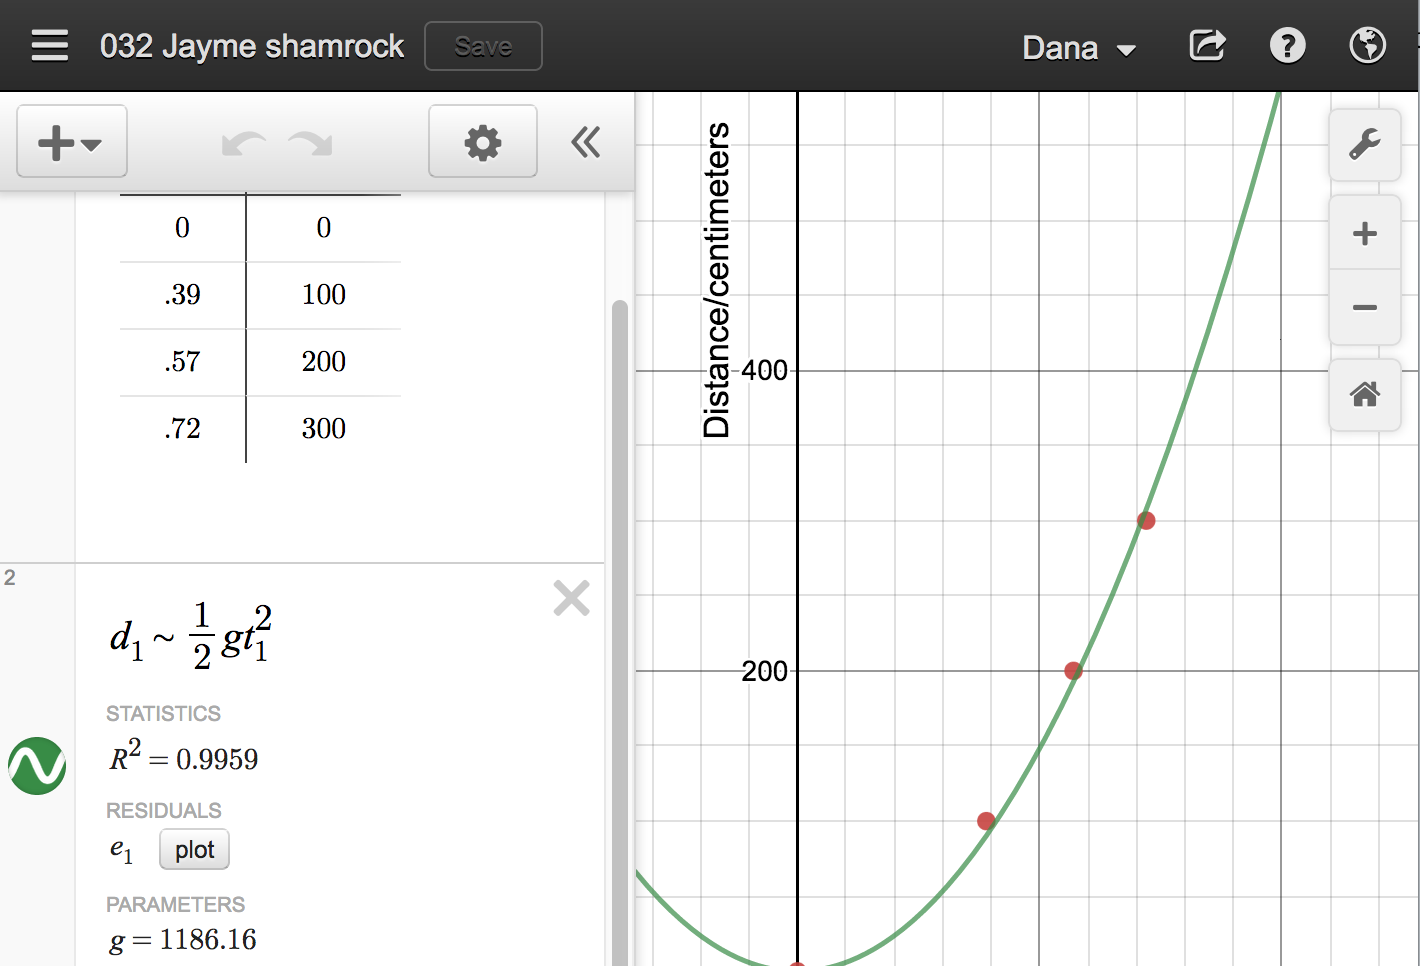
- __________ Calculate the slope of the line.
- __________ Calculate the intercept of the line.
- __________ cm. How far will the RipStik travel in 23 seconds? Note that d = ѵ × t.
- __________ seconds. How long in seconds for the RipStik to travel 7500 centimeters?
- _________℃ What is the temperature of a mix of melting ice and water?
- _________℃ What is the indoor temperature in Pohnpei?
- _________℃ What is the temperature of the healthy living human body?
- _________℃ What is the temperature of a boiling water in laboratory six?
- _________ _____ Room A101 is at E 158° 09.663'. Binky was at E 158° 09.538'. Calculate the difference in arcminutes between A101 and Binky.
- _________ _____Use the difference in arc minutes from part a) and the laboratory seven experimental value of 1850 meters per arcminute of longitude here on Pohnpei to calculate the distance in meters from A101 to Binky.
frequency f = 1 ÷ (period T )
velocity ѵ = wavelength λ * frequency f
- On the diagram above, label a crest.
- On the diagram above, label a trough.
- __________ How many wavelengths can be seen on the three sheets of paper?
- λ = _________ _________ What is the wavelength λ of ONE wave?
- a = _________ _________ What is the amplitude a for the wave?
- τ = _________ _________ What is the period τ of ONE wave?
- f = _________ _________ Given that frequency f = 1 ÷ (period τ ) , what is the frequency f?
- ѵwave = _________ _________ Given that velocity ѵ = wavelength λ × frequency f, what is the wave velocity ѵwave?
 From laboratory ten, list the three primary colors of light:
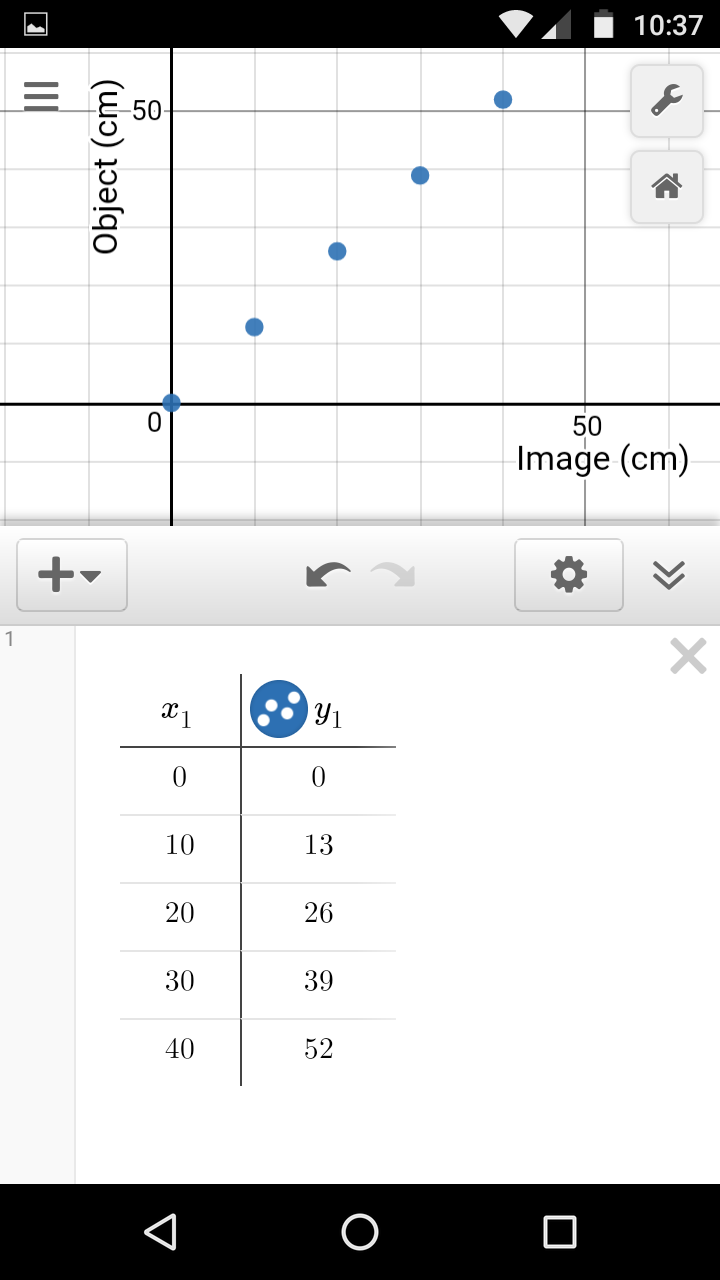
- ______________ Calculate the slope of the line. The slope is the experimental index of refraction for water.
- ______________ __________ Use the slope above to predict the object depth for a penny that appears to be 30 cm underwater.
- ______________ __________ Use the slope above to predict the image depth for a coral head that is actually 200 cm underwater.
- ______________ Water has a published index of refraction of 1.33. What is the error for the slope?
- ______________ Water has a published index of refraction of 1.33. What is the percentage error for the slope?


- __________ _____ Given Ohm's law that V = iR, calculate the resistance R for the dryer.
- __________ _____ Given that P = iV, calculate the power P for the dryer.
- __________ Power is now forty cents per kiloWatt hour, or $0.40 for 1000 Watts for one hour. How much does it cost to run the dryer for one hour?
- _______________ In general, what color do acids tend to turn floral pigment fluids?
- _______________ In general, what color do bases tend to turn floral pigment fluids?
- _______________ Are lime fruits acid, base, or neutral?
- _______________ Is vinegar an acid, base, or neutral?
- _______________ Is cream of tartar an acid, base, or neutral?
- _______________ Is water an acid, base, or neutral?
- _______________ Is baking soda an acid, base, or neutral?
- _______________ Is ammonia an acid, base, or neutral?
- _______________ Is a bar of hand soap an acid, base, or neutral?
- _______________ Is laundry detergent an acid, base, or neutral?
- _______________ Is bleach an acid, base, or neutral?
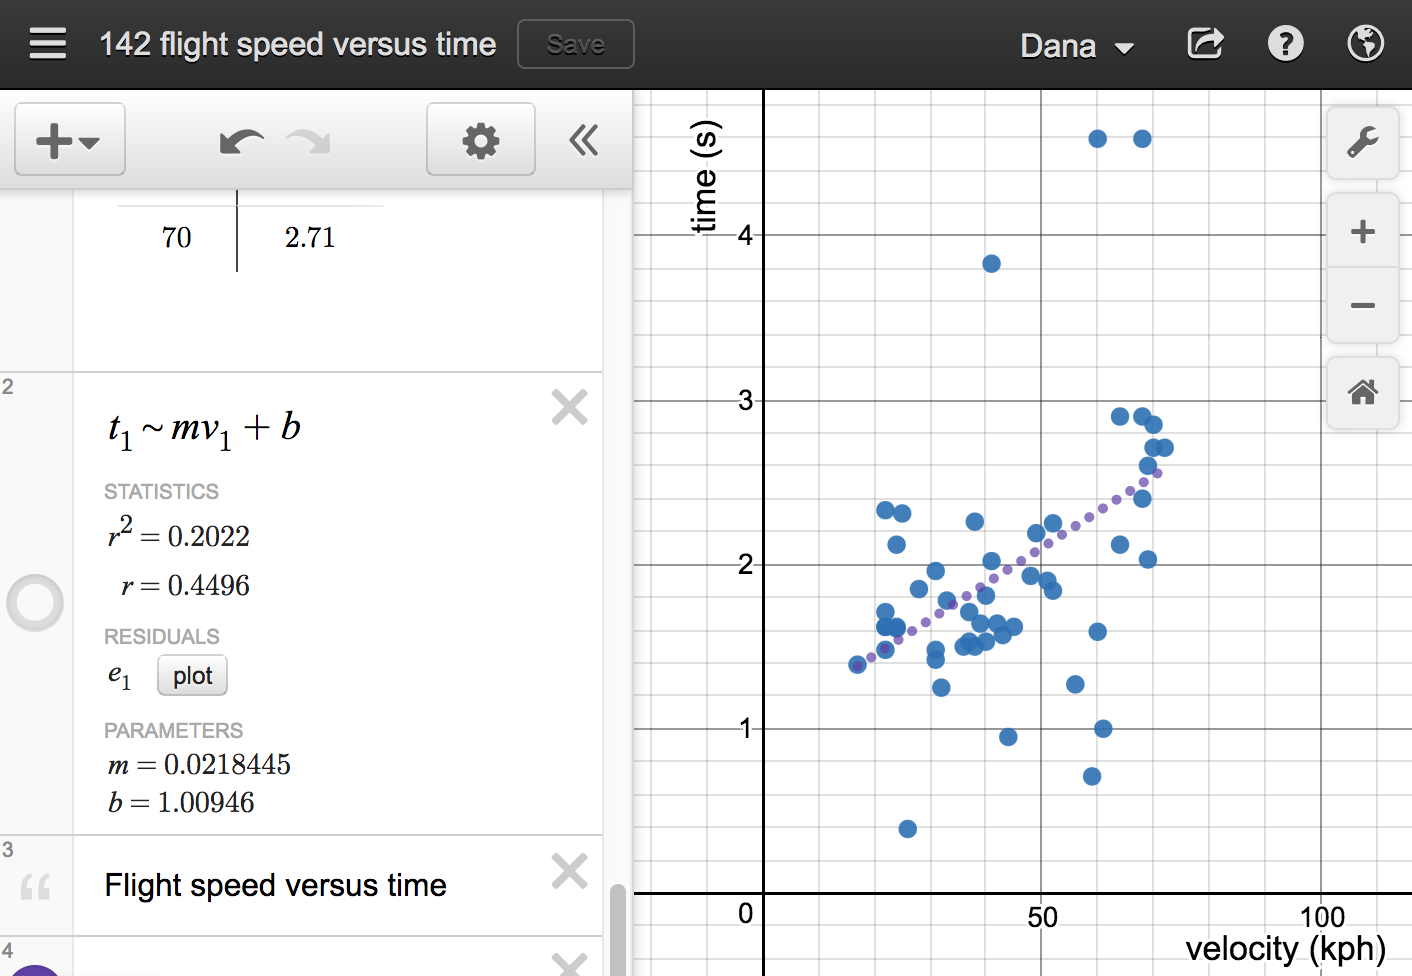
What, if anything, can you conclude about the relationship between the launch velocity & flight time, and why?