__________ __________ A RipStike accelerated as in the chart. The curve on the graph is the acceleration of RipStik. Using the point D (5 seconds, 800 cm) and the equation d = ½at², calculate the acceleration of the RipStik.
__________ __________ Using an acceleration of gravity g = 980 cm/s², how far will a ball fall in 3 seconds?
__________ __________ Using an acceleration of gravity g = 980 cm/s², how many seconds for a ball to fall 1960 cm?
__________ __________ Using the equation velocity = acceleration × time and gravity g = 980 cm/s², how many seconds until a falling ball has a velocity of 257 cm/s (the speed of my RipStik on Monday)?
__________ __________ Using d = ½at² determine from how high the ball would have to be dropped in order to have reached the speed of the RipStik.
Based on your work in laboratory three, how can you know that the ball is falling faster and faster as the ball falls?
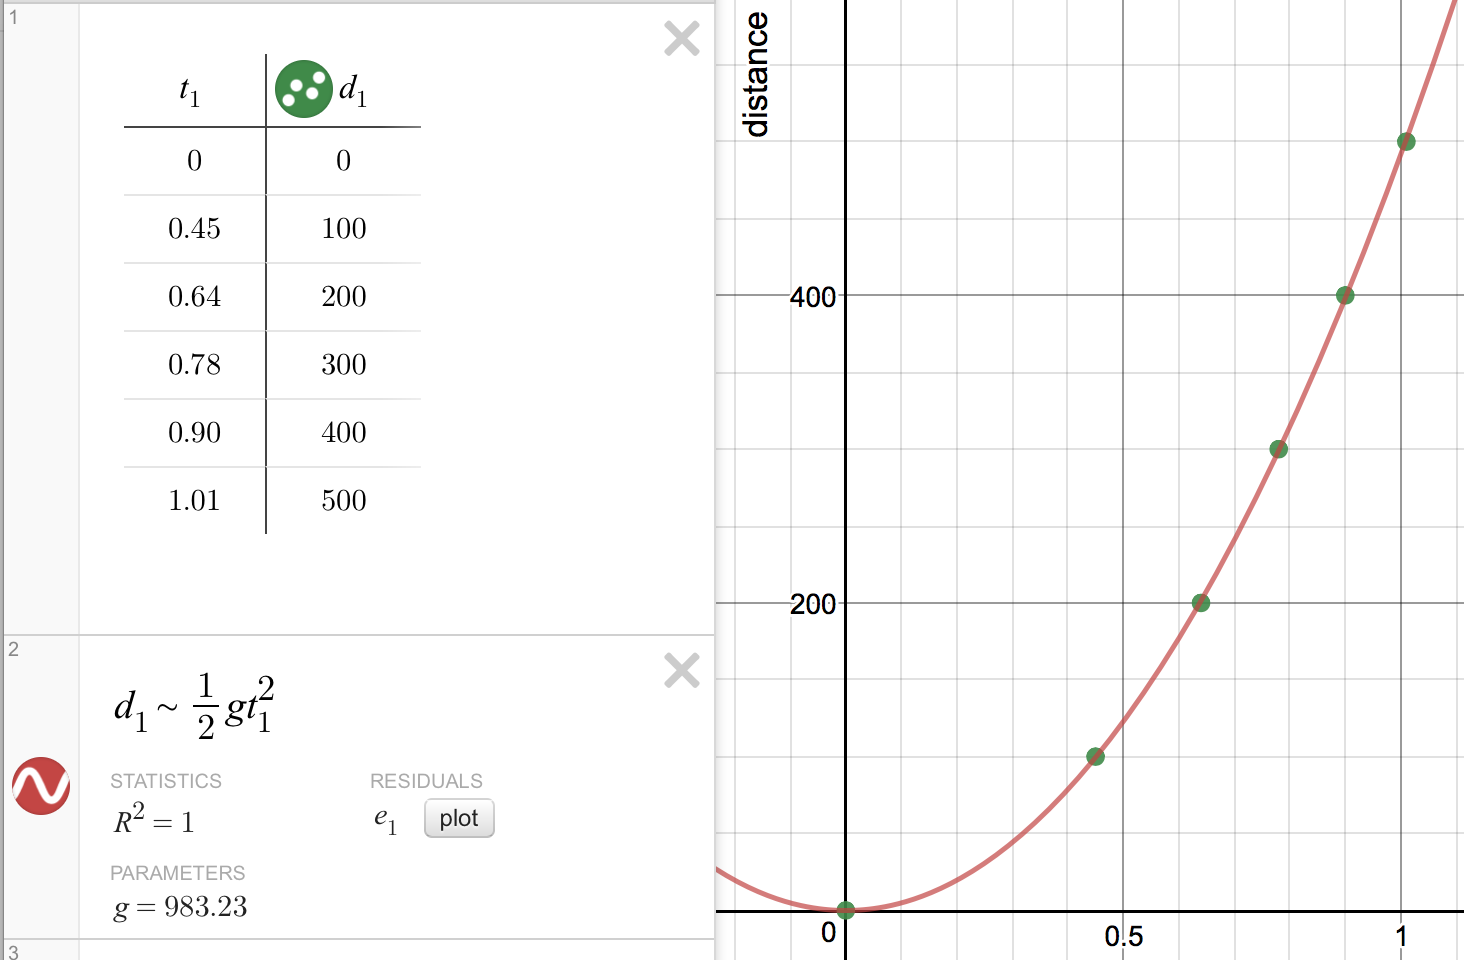
__________ __________ For the Desmos graph and regression, determine the acceleration of gravity g.
distance d = velocity ѵ × time t
ѵ = at ѵ = gt d = ½at² d = ½gt²
where g is the acceleration of gravity g = 980 cm/s²