- __________ _____ Calculate the density ρ of Dial Basic soap.
- ______________ Based on the density, will Dial Basic soap float or sink?
- __________ _____ Using the density above, calculate the mass of a bar of Dial Basic soap that has a volume of 160 cm³.
- __________ _____ Using the density above, calculate the volume of a bar of Dial Basic soap that has a mass of 250 grams.
- __________ _____ Calculate the density ρ of Ivory soap.
- ______________ Based on the density, will Ivory soap float or sink?
- __________ _____ Calculate the density ρ of Neutrana soap.
- ______________ Critical thinking: Based on the density, will Neutrana soap float or sink?
- __________ _____ Determine the velocity ѵ of the RipStik.
- __________ _____ If the RipStik continued at that velocity for 30 seconds, how many centimeters would the RipStik travel?
- __________ _____ If the RipStik continued at that velocity for 5600 centimeters, how many seconds would the RipStik travel?
- __________ _____ Calculate Fastlynn's speed in centimeters per second.
- _______________ Is Fastlynn faster or slower than 202 cm/s speed of the RipStik on Monday 22 August?.
- __________ seconds. How long in seconds for Fastlynn to run 100,000 centimeters (equals one kilometer)?
- Plot the data using circles and squares for A and B respectively.
- __________ __________ Calculate the velocity for RipStik run A.
- __________ __________ Calculate the velocity for RipStik B from 0 to 2 seconds.
- __________ __________ Calculate the velocity for RipStik B from 2 to 4 seconds.
- __________ __________ Based on the above two calculations, by how much did the velocity increase for RipStik B?
- __________ __________ Calculate the average acceleration of RipStik B over the four seconds from 0 to 4 seconds by dividing the change in velocity by four seconds.
- __________ __________ The curve on the graph is the acceleration of RipStik. Using the point D (5 seconds, 800 cm) and the equation d = ½at², calculate the acceleration of the RipStik.
- __________ _____ What was the acceleration of gravity that you measured on Thursday?
- ___________________ Given that the actual acceleration of gravity is g = 980 cm/s², was your experimentally measured value for the acceleration of gravity too high or too low?
- ☐ The RipStik rolls at a constant rate of speed.
- ☐ The RipStik rolls less than twice as fast from twice as high.
- ☐ The RipStik rolls twice as fast from twice as high.
- ☐ The RipStik rolls more than twice as fast from twice as high.
- ___ With increasing height, the velocity increases at an increasing rate.
- ___ With increasing height, the velocity increases at a constant rate.
- ___ With increasing height, the velocity increases at a decreasing rate.
- ___ Which of these functions depicts what really happened on Monday: A, B, or C?
- __________ __________ ...the momentum p of the car.
- __________ __________ ...the kinetic energy KE of the car.
- __________ __________ Calculate the Gravitational Potential Energy of the marble before the marble is released.
- __________ __________ Determine the Kinetic Energy that the marble should have at the bottom of the ramp.
- __________ __________ Calculate the velocity that the marble should have at the bottom of the ramp.
- __________ In the laboratory using an actual marble and banana leaf, will the marble have the speed you just calculated?
- __________ Will the actual marble be faster OR slower?
- Newton's first law of motion.
- Newton's second law of motion.
- Newton's third law of motion.
- _________℃ Ice melts/water freezes.
- _________℃ Coconut oil melts/freezes.
- _________℃ Typical daily indoor room temperature in Pohnpei.
- _________℃ Healthy living human body core temperature.
- _________℃ Water boils.
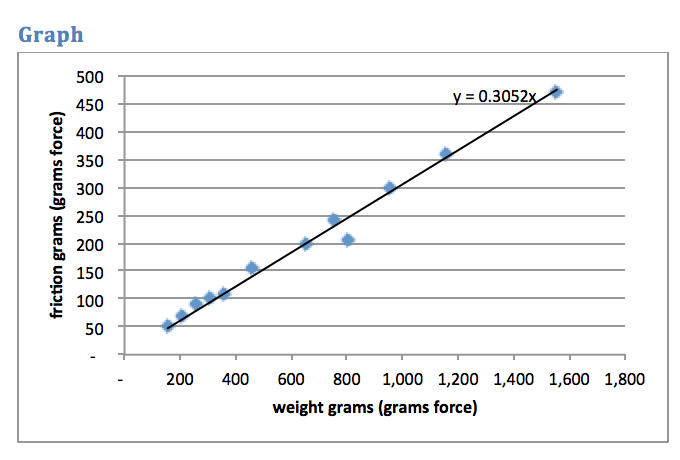
Weight: force = 0.3052×weight
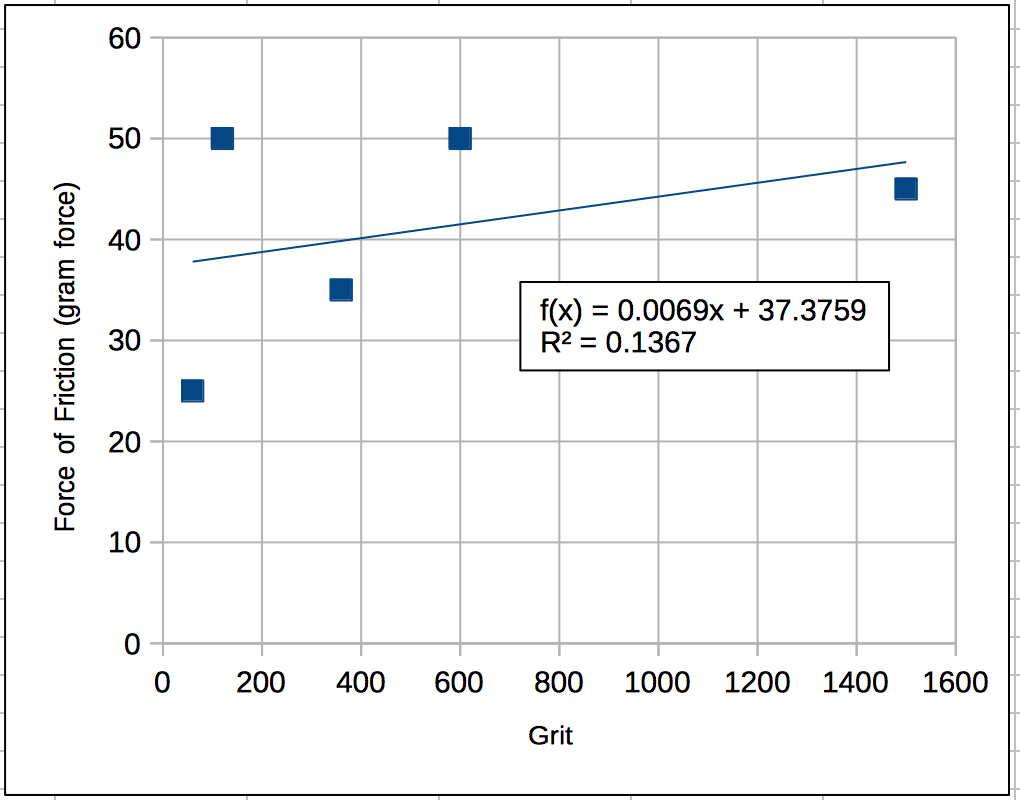
Grit: force = 0.0069×grit + 37.37
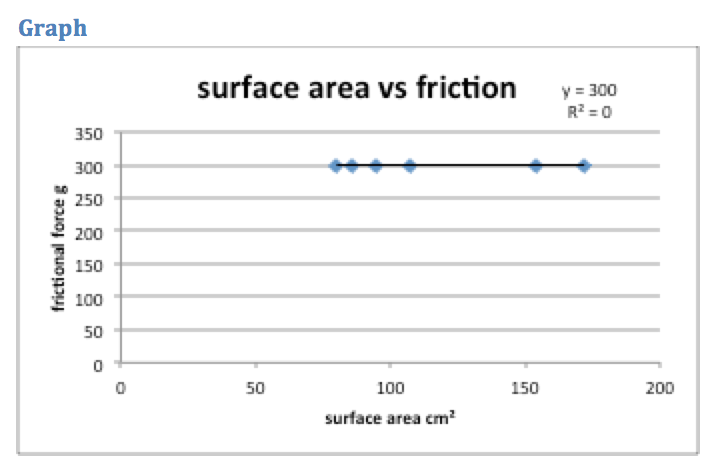
Surface area: force = 0.000×surface area + 300
- _______________ Based on the data gathered and shared in class, which variable has the most effect on the force of friction?
- ______________ __________ If a weight of 1000 grams were put on the glass sled used to generate the weight graph, what would be the force of friction?