The first graph plots data from a soap density measurement laboratory. The slope of the line is the density of the soap.
__________ Calculate the slope of the line.
______________ Determine the y-intercept of the line.
y = _________ x + __________ Write the y = mx + b slope-intercept equation for the line.
____________________________ Write the units of measurement for the x-axis.
____________________________ Write the units of measurement for the y-axis.
____________________________ Write the units of measurement for the slope.
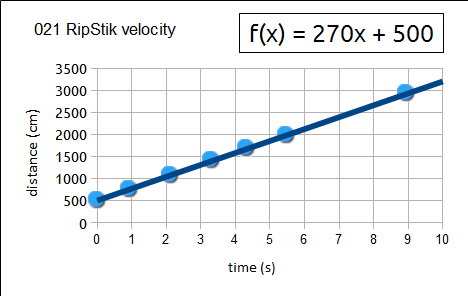
A student gathered the data seen in the table below.
Plot the data.
__________ Calculate the slope of the line.
__________ Calculate the intercept of the line.
__________ cm. How far will the RipStik travel in 23 seconds?
__________ seconds. How long in seconds for the RipStik to travel 7500 centimeters?
__________ What is the slope of the line y = 2.0 + 0.15x?
__________ What is the y-intercept of the line y = 2.0 + 0.15x?
The graph shows soap density data. Use the graphed data to answer the following questions.
__________ _____ Calculate the density ρ of Dial Basic soap (include units!).
______________ Based on the density, will Dial Basic soap floatorsink?
__________ _____ Using the density above, calculate the mass of a bar of Dial Basic soap that has a volume of 100 cm³.
__________ _____ Using the density above, calculate the volume of a bar of Dial Basic soap that has a mass of 250 grams.
__________ _____ Calculate the density ρ of Ivory soap.
______________ Based on the density, will Ivory soap floatorsink?
In the 8:00 laboratory section every group that measured Ivory soap obtained a density greater than one based their slope. Yet the Ivory soap was shown to float. Which are they more likely to have measured incorrectly and explain WHY: the volume or the mass?
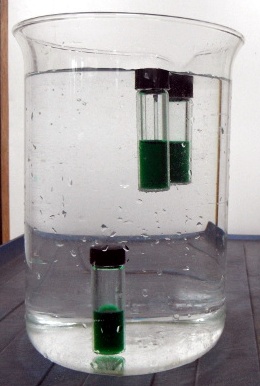
As seen in the image, three identical vials have equal amounts of a green liquid. In terms of density, why are two floating and one has sunk to the bottom?
______________ In grams per cubic centimeter, what is the density of water?
Spring 2013 I was puzzled by a bar of blue Lux Wake Me Up soap. I gathered data and made the chart shown based on the data. The slope was 0.9853 g/cm³. When placed in water the soap sank.
What was unexpected about this result?
Explain why this might have happened.
The graph shows the time versus distance data gathered for four different ball speeds in laboratory 02.
__________ _____ Determine the velocity ѵ of ball A.
__________ _____ Determine the velocity ѵ of ball B.
__________ _____ Determine the velocity ѵ of ball C.
__________ _____ Determine the velocity ѵ of ball D.
For the following RipStik velocity chart:
__________ _____ Determine the velocity ѵ of the RipStik.
__________ _____ If the RipStik continued at that velocity for 20 seconds, how many centimeters would the RipStik travel?
__________ _____ If the RipStik continued at that velocity for 8600 centimeters, how many seconds would the RipStik travel?
A RipStik was ridden three times at three different velocities (speeds). The data was gathered in the table seen below.
Plot the data using circles, squares, and diamonds for A, B, and C respectively.
__________ __________ Calculate the velocity (speed) of RipStik run A. Do not forget to include the units!
__________ __________ Calculate the velocity (speed) of RipStik run B.
__________ __________ Calculate the velocity (speed) of RipStik run C.
__________ Which RipStik run is the fastest (A, B, or C)?
__________ Which RipStik run is the slowest (A, B, or C)?
__________ __________ Based on the slope and intercept, how far will RipStik A travel in 23 seconds?
__________ __________ Based on the slope and intercept, how long in seconds for RipStik B to travel 6000 centimeters?
__________ _____ Calculate the distance a ball with a velocity ѵ of 777 cm/s will roll in six seconds.
__________ _____ Calculate the time for a ball with a velocity ѵ of 243 cm/s to roll 729 centimeters.
The graph shows soap density data. Use the graphed data to answer the following questions.
__________ _____ Calculate the density ρ of Dial Basic soap.
______________ Based on the density, will Dial Basic soap floatorsink?
__________ _____ Using the density above, calculate the mass of a bar of Dial Basic soap that has a volume of 100 cm³.
__________ _____ Using the density above, calculate the volume of a bar of Dial Basic soap that has a mass of 250 grams.
__________ _____ Calculate the density ρ of Ivory soap.
______________ Based on the density, will Ivory soap floatorsink?
__________ _____ Calculate the density ρ of Neutrana soap.
______________ Based on the density, will Neutrana soap floatorsink?
For the following RipStik velocity chart:
__________ _____ Determine the velocity ѵ of the RipStik.
__________ _____ If the RipStik continued at that velocity for 30 seconds, how many centimeters would the RipStik travel?
__________ _____ If the RipStik continued at that velocity for 7790 centimeters, how many seconds would the RipStik travel?
The time versus distance for three pitches (A, B, C) of a kick ball were recorded in the table below.
Plot the data using circles, squares, and diamonds for A, B, and C respectively.
__________ __________ Calculate the velocity of ball A.
__________ __________ Calculate the velocity of ball B.
__________ __________ Calculate the velocity of ball C.
__________ Which ball is the fastest (A, B, or C)?
__________ Which ball is the slowest (A, B, or C)?
__________ __________ Based on the velocity, how far will ball A travel in 8 seconds?
__________ __________ Based on the velocity, how long in seconds for ball A to travel 2800 centimeters?
__________ __________ The curve on the graph is the acceleration of RipStik. Using the point D (5 seconds, 800 cm) and the equation d = ½at², calculate the acceleration of the RipStik.
A superball is released from a hand and falls for three seconds.
__________ _____ Using the equation d = ½gt² and an acceleration of gravity g = 979 cm/s², how far does the superball fall in centimeters?
__________ _____ At the end of the three seconds, what is the speed of the superball?
A superball falls for 700 centimeters from the height of the new windows in the gym.
__________ _____ How long does the superball fall in seconds if the acceleration of gravity g is 979 cm/s²?
__________ _____ After falling for 700 cm, what is the speed of the superball?
A student rolled marbles into a line of five marbles.
_________ If one marble collides with a line of five marbles on a ruler track, how many marbles are ejected (go out)?
_________ If two marbles collide with a line of five marbles on a ruler track, how many marbles are ejected (go out)?
___________________ If one marble moving very fast collides with a line of five marbles on a ruler track, what is the speed of the ejected marble(s)?
Write Newton's first law of motion.
Write Newton's second law of motion.
Write Newton's third law of motion.
The graph shows pulley data gathered by a student in physical science.
Plot the data provided in the table on the graph below and draw a line through the points.
____________ Based on the data, what is the Actual Mechanical Advantage for the pulley system?
____________ The pulley system had four load lines. What is the Ideal Mechanical Advantage?
____________ Use the preceding two questions to calculate the efficiency of the pulley system.
______________ What was the likely cause of the efficiency being less than 100%?
Temperatures in Celsius:
_________℃ What is the temperature of a mix of melting ice and water?
_________℃ What is the temperature of melting solidified coconut oil?
_________℃ What is the typical daily indoor room temperature in Pohnpei?
_________℃ What is the temperature of the healthy living human body?
_________℃ What is the temperature of a boiling water?
Explain the difference between heat and temperature.
Explain the following types of heat movement:
Conduction:
Convection:
Radiation:
Mathematical models
_____
Identify by the letter which of the mathematical relationships on the graph represents the time versus distance relationship for a RipStik moving at a constant linear velocity with no acceleration (as in the homework 021 in the second week).
_____
Identify by the letter which of the mathematical relationships on the graph represents the time versus distance relationship for a ball falling under the constant acceleration of gravity g (as in laboratory three).
_____
Identify by the letter which of the mathematical relationships on the graph represents the height versus velocity relationship for a marble rolling from a height h down a banana leaf and onto a flat table (homework 041).
_____
Identify by the letter which of the mathematical relationships on the graph represents the length versus mass for a cantilever arm balance.
A RipStik was swizzled ("wiggled") across a poster paper just as I did on Wednesday. The sinusoidal swizzle wave can be seen in the diagram.
_________ How many waves are there on the "paper" above?
λ = _________ _________ What is the wavelength λ of ONE wave?
a = _________ _________ What is the amplitude a?
τ = _________ _________ What is the period τ of ONE wave?
f = _________ _________ Calculate the RipStik swizzle wave frequency f.
ѵwave = _________ _________ Use the wavelength λ and frequency f to calculate the velocity ѵwave of the RipStik swizzle wave.
Sketch a wave with a wavelength of 12 centimeters and an amplitude of 2 centimeters for x = 0 to 12 centimeters
During the laboratory the west wind rose up the ridge to the east of campus generating rain as the air rose up the ridgeline. This is called orographic or terrain induced rain. Explain how the wind and the ridge produce this rain.
A student gathered the data seen in the table below.
Plot the data on the graph.
__________ __________ Calculate the experimental speed of sound based on the data. Include the units with your answer.
__________The published value was 349 m/s. Calculate the percentage error for this data.
__________ __________ Based on the experimental data, how long for a sound to travel 615.6 meters?
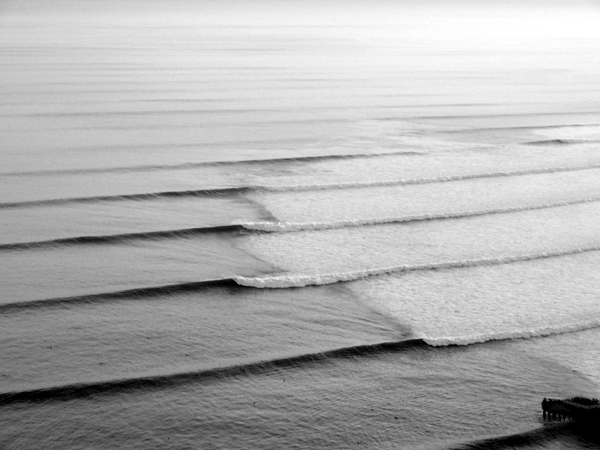
In the following image identify the crests and troughs.
Define latitude:
Define longitude:
______________
When walking straight East, which number would change on the GPS unit,
the N 06° 54.594'or the E 158° 09.339' number?
_________ _____ The classroom is at E 158° 09.651'. I hid at E 158° 09.339'. Calculate the difference in minutes between the classroom and where I was hiding.
The classroom is at E 158° 09.651'. I hid at E 158° 09.339'. Use a value of 1842 meters per minute to calculate the distance in meters from the classroom to Binky.
A RipStik was swizzled ("wiggled") across a poster paper. The sinusoidal swizzle wave can be seen in the diagram.
_________ How many waves are there on the "paper" above?
λ = _________ _________ What is the wavelength λ of ONE wave?
a = _________ _________ What is the amplitude a?
τ = _________ _________ What is the period τ of ONE wave?
f = _________ _________ Calculate the RipStik swizzle wave frequency f.
ѵwave = _________ _________ Use the wavelength λ and frequency f to calculate the velocity ѵwave of the RipStik swizzle wave.
List the seven colors of the Newtonian rainbow:
What is the scientific name for the spread of colors that was seen in the box with the CD?
List the three primary colors of light:
List the three secondary colors of light:
List the three primary colors of pigments, paints, dyes, food color, and crayons:
List the three secondary colors of pigments, paints, dyes, food color, and crayons:
Sketch a wave with a wavelength of 12 centimeters and an amplitude of 2 centimeters for x = 0 to 12 centimeters
A student gathered the data seen in the table below.
Plot the data on the graph.
__________ __________ Calculate the experimental speed of sound based on the data. Include the units with your answer.
__________The published value is 349 m/s. Calculate the percentage error for this data.
__________ __________ Based on the experimental data, how long for a sound to travel 615.6 meters?
Hue Saturation Luminosity (HSL) colors:
Define Hue:
Define Saturation:
Define Luminosity:
What is the name of the computer color system that uses color words such as red, crimson, cyan, antiquewhite, saddlebrown?
What color of light does an orange ball reflect?
What color of light does an orange ball absorb?
Define reflection:
Define refraction:
Define total internal reflection:
Plot the following data on the graph provided and draw a linear best fit line through the data points on the graph.
______________ Calculate the slope of trend line. The slope is the experimental index of refraction for water.
______________ __________ Use the trend line to calculate the actual depth for a coral head the image of which appears to be 100 cm underwater.
______________ __________ Use the trend line to calculate the image depth for a coral head that is actually 200 cm underwater.
______________ Ocean water in the western Pacific is reported to have an an actual index of refraction of 1.34. What is the percentage error?
The spar mixer uses 2200 Watts of power at 220 Volts.
__________ _____ Calculate the current i for the spar mixer.
__________ _____ Calculate the resistance R for the spar mixer.
A Whirlpool dryer uses 26 amps of current at 240 volts.
__________ _____ Calculate the resistance R for the dryer.
__________ _____ Calculate the power P for the dryer.
__________ _____ How long can the dryer run on a single kilowatt (1000 Watts)?
__________ _____ If cash power is $0.50 per kWh, calculate the cost to run the dryer for eight hours.
A Haier household refrigerator uses 1.2 amps of current at 115 volts.
__________ _____ Calculate the resistance R for the refrigerator.
__________ _____ Calculate the power P for the refrigerator.
__________ _____ How long can the refrigerator run on a single kilowatt (1000 Watts)?
__________ What is the atomic number of Zn?
__________ What is the atomic mass of Zn?
__________ How many protons does Zn have?
__________ How many neutrons does Zn have?
__________ How many electrons does Zn have?
____________________ Zn was an element tested in the electrical conductivity, what is the full name for Zn?
Remember that the number of neutrons equals or exceeds the number of protons. The number of protons cannot exceed the number of neutrons in a stable element. Thus the more numerous nucleons are the neutrons.
_______________ Looking only at the atomic diagram, determine the atomic number of the atom depicted.
_______________ Looking at the diagram, what is the atomic mass for the atom?
_______________ Looking at the diagram and the chart on the wall, what is the one or two letter chemical abbreviation for this element?
_______________ Looking at the diagram and the chart on the wall, what is the full name for this element?
_______________ What is the common name for compound with the formula H2O?
_______________ In general, what color do acids tend to turn floral pigment fluids?
_______________ In general, what color do bases tend to turn floral pigment fluids?
_______________ Are lime fruits acid, base, or neutral?
_______________ Is vinegar an acid, base, or neutral?
_______________ Is cream of tartar an acid, base, or neutral?
_______________ Is water an acid, base, or neutral?
_______________ Is baking soda an acid, base, or neutral?
_______________ Is ammonia an acid, base, or neutral?
_______________ Is a bar of hand soap an acid, base, or neutral?
_______________ Is laundry detergent an acid, base, or neutral?
_______________ Is bleach an acid, base, or neutral?
On Monday, first Alec Baldwin talked about the ___ ___ ___ ___. It is 238,900 miles from us or the Earth. So far there have been 12 astronauts who walked on this object, with the first one to step on the surface being Neil Armstrong.
The second object covered was ___ ___ ___ ___ ___, the goddess of love. This object is the same size as the our planet Earth but he air is noxious, pressure, unbearable, and very hot approaching 900 degrees. This is one angry goddess, a sister planet from hell. Stick around you’d be suffocated and crushed. Nothing can survive here.
The planet ___ ___ ____ ___ ___ ___ ___ is the one closest to the sun so of course it's hot also. This object has no atmosphere to retain heat which resulted with the greatest experience in temperature variation. 100 Kelvin at night (-173 Celsius, -279 Fahrenheit) and 700 Kelvin (427 Celsius, 800 Fahrenheit) during the day.
At the center of the solar system is the ___ ___ ___. This object is a star with the stellar name Sol, hence the "solar system." A million Earths would fit inside this object.
Comets, are icy small objects that pass near the center of the solar system, heat up and begin to out gas, displaying a visible atmosphere or coma, and sometimes also a tail.
Moving out now from the Earth is the red planet, ___ ___ ___ ___, a dead planet; a giant fossil. It's too dusty that we can hardly see. It has a volcano, Olympus Mons, that is three times higher than Mount Everest. No ozone layer, frozen waters all over. A canyon larger than the Grand Canyon on the Earth. Geological evidence gathered by missions suggests that this object once had large-scale water coverage on its surface at some earlier stage of its life.
___ ___ ___ ___ ___ ___ ___ is the fifth planet and is so big that all of the other planets can fit inside it. This is the largest planet in our solar system. The planet is primarily composed of hydrogen and is a gas giant, there is no solid surface. The best known feature of the largest planet is the Great Red Spot, a storm bigger than earth that is centuries old. It also has electrical storms that just one bolt is a thousand times more intense than any on earth. Io is a multi-colored moon that is orbiting this planet, with the colors produced by active volcanoes and lava. Io is hot, but ___ ___ ___ ___ ___ ___ is cold. Ice cold. With icy ridges and cracks that are much like the Arctic.
___ ___ ___ ___ ___ ___ is the sixth planet and the second of the gas giants. This gas giant is known for its rings, rings that can be seen with a telescope from Earth. its spectacular rings span the distance from the Earth to Moon. This rings are made of billions of chunks of ice orbiting the planet in a flat disk, the chunks collide and break apart continuously, coming together and smashing to form more chunks. ___ ___ ___ ___ ___ is the largest moon of this planet famed for its rings. it is the only natural satellite known to have a dense atmosphere, and the only object other than Earth where clear evidence of stable bodies of surface liquid has been found. This moon has lakes of methane on the surface, has an atmosphere, it has methane rain, wind, and even seasons. It has rivers, lakes and oceans that are made of liquid natural gas.
___ ___ ___ ___ ___ ___ is the seventh planet and is not visible to the naked eye, and became the first planet discovered using the telescope. Composed primarily of hydrogen and helium, the whole planet is spinning tilted over 98 degrees relative to the rest of the planets. This planet is spinning tipped over onto its "side" so to speak.
The planet named for the goddess of sea is ___ ___ ___ ___ ___ ___ ___. It is 2,795,000,000 miles in distance from the center of the solar system. Covered in hydrogen, helium, and methane gas, this object is the last of the four gas giant planets in the solar system. A storm as big as earth has been photographed in the atmosphere. The largest moon, ___ ___ ___ ___ ___ ___, is solid but not stable. The moon is too close to the planet, gravitational forces, massive tidal forces acting on the rock mantle of the moon, generate geysers of dust and violent quakes. One day the planet will rip apart this moon.
___ ___ ___ ___ ___ was a planet but was recently demoted to a dwarf planet. This planet is like a frozen rock. Scientists refer to the small sub-planetary objects in the outer solar system as dwarf planets. This first of the dwarf planets has five known moons, Charon, Styx, Nix, and Kerberos, and Hydra. This is a lonely planet a billion miles from home.
Lastly on Monday, Alec Baldwin mentioned ___ ___ ___ ___ ___ an icy world, discovered in 2003 and is twice as far from the Sun. This is a cold dwarf planet since it’s a great distance from the sun. This object is smaller than some of the other dwarf planets. Eight billion miles from earth, a small and icy planetoid that is the most distance object ever seen that orbits the center of the solar system, this object was discovered in 2003. Its orbit takes ten thousand years to complete.
The graph plots three data sets for three different possible mathematical models for the frisbee data. One data set is plotted as squares, one as circles, and a third as triangles.
__________ Which shape plots data modeled by a linear mathematical trend line model?
__________ Which shape plots data modeled by a non-linear mathematical trend line model?
__________ Which shape plots data that is randomly distributed and cannot be modeled by a trend line model?
__________ For the data that plots linearily, make a mathematical estimate of the slope.
__________ For the data that plots linearily, make a mathematical estimate of the y-intercept.
Vera Ruben studied the rotation rate of stars around the centers of galaxies. According to Newton's theory of gravitation, stars closer to the center of the galaxy should be moving more rapidly around the center of the galaxy than stars farther out from the center. Is that what Dr. Rubin found, and if not, what did she find to be true?
Carlos Frenk discovered that without dark matter, computer simulations of the universe did not form galaxies. For galaxies to form, Frenk found which of the following to be true:
(a) Dark matter had to be one fifth the mass of visible matter.
(b) Dark matter had to be equal to the mass of visible matter.
(c) Dark matter had to be five times the mass of visible matter.
The Soudan mine dark matter experiment searched for dark matter particles called ____________________.
________ Does dark matter interact with itself?
More recent research has revealed the existence of dark energy. Dark energy is an unknown source of energy that is causing the universe to expand faster and faster. In the phantom energy theory dark energy will eventually rip the universe apart in an event called the "Big Rip." When will the Big Rip happen?
(a) Before final examinations (b) This summer (c) Within your lifetime (d) Billions of years from now
Does a site swap throw of 3 land in the same hand or the other hand?
Use arrows to trace the path for the ball below for the site swap equation 3 and 51
3: ⚽  ⚽  ⚽
   ___ ___ ___ ___ ___ ___ ___ ___ ___ ___ ___ ___
    R   L   R   L   R   L   R   L   R   L   R   L


51: ⚽     ⚽      ⚽
   ___ ___ ___ ___ ___ ___ ___ ___ ___ ___ ___ ___
    R   L   R   L   R   L   R   L   R   L   R   L
Volume V = length l × width w × height h
mass m = density ρ × Volume V
distance d = velocity ѵ × time t ѵ = at ѵ = gt d = ½at² d = ½gt²
where g is the acceleration of gravity g = 979 cm/s²
Gravitational Potential Energy GPE = mgh
acceleration of gravity g = 979 cm/s²
Kinetic Energy KE = ½mѵ²
momentum = mass m × velocity ѵ
Force F = mass m × acceleration a
period τ = 1 ÷ (frequency f )
velocity ѵ = wavelength λ * frequency f
 As seen in the image, three identical vials have equal amounts of a green liquid. In terms of density, why are two floating and one has sunk to the bottom?
 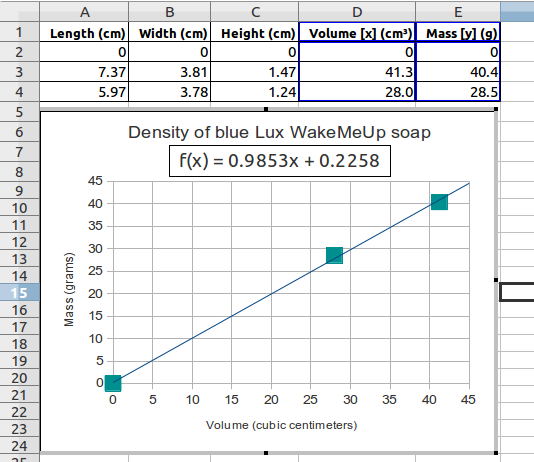 Spring 2013 I was puzzled by a bar of blue Lux Wake Me Up soap. I gathered data and made the chart shown based on the data. The slope was 0.9853 g/cm³. When placed in water the soap sank.