The first graph plots data from a soap density measurement laboratory. The slope of the line is the density of the soap.
__________ Calculate the slope of the line.
______________ Calculate the y-intercept of the line.
____________________________ Write the y = mx + b slope-intercept equation for the line.
A student gathered the data seen in the table below.
Plot the data.
__________ Calculate the slope of the line.
__________ Calculate the intercept of the line.
__________ How far will the RipStik travel in 23 seconds?
__________ How long in seconds for the RipStik to travel 7500 centimeters?
__________ What is the slope of the line y = 5.5 + 0.85x?
__________ What is the y-intercept of the line y = 5.5 + 0.85x?
A student gathered the data seen in the table below.
Plot the soap data on the graph.
__________ __________ Calculate the density of the soap. Include the units with your answer.
Based on the slope, will the soap [float]OR[sink]?
Based on the slope, is this likely to be [Ivory]OR[Dial] soap?
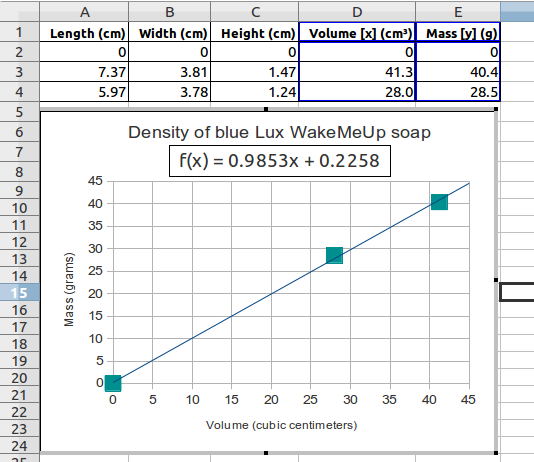
Spring 2013 I was puzzled by a bar of blue Lux Wake Me Up soap. I gathered data and made the chart shown based on the data. The slope was 0.9853 g/cm³. When placed in water the soap sank.
What was unexpected about this result?
Explain why this might have happened.
A RipStik was ridden three times at three different velocities (speeds). The data was gathered in the table seen below.
Plot the data using circles, squares, and diamonds for A, B, and C respectively.
__________ __________ Calculate the velocity (speed) of RipStik run A. Do not forget to include the units!
__________ __________ Calculate the velocity (speed) of RipStik run B.
__________ __________ Calculate the velocity (speed) of RipStik run C.
__________ Which RipStik run is the fastest (A, B, or C)?
__________ Which RipStik run is the slowest (A, B, or C)?
__________ __________ Based on the slope and intercept, how far will RipStik A travel in 23 seconds?
__________ __________ Based on the slope and intercept, how long in seconds for RipStik B to travel 6000 centimeters?
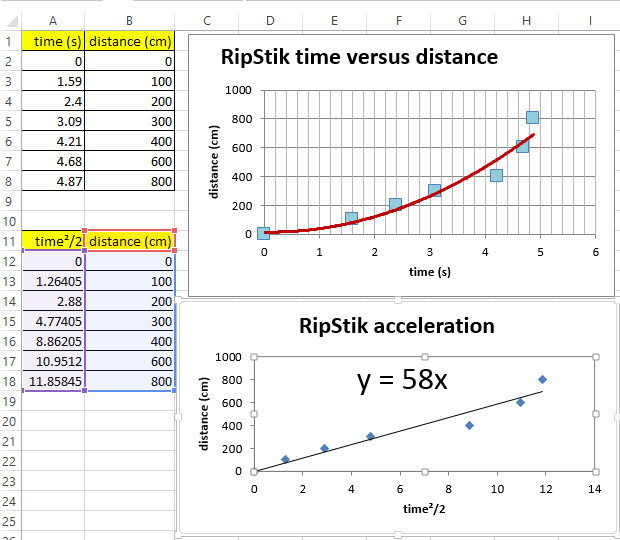
On Tuesday I accelerated a RipStik gathering the data seen below.
_______________ _________ Based on the data, what was the acceleration of the RipStik?
_______________ _________ Use the equation velocity ѵ = acceleration a × time t to determine my velocity after 4.87 seconds.
_______________ _________ If I continued that same acceleration for 9.74 seconds, how far would I go in centimeters?
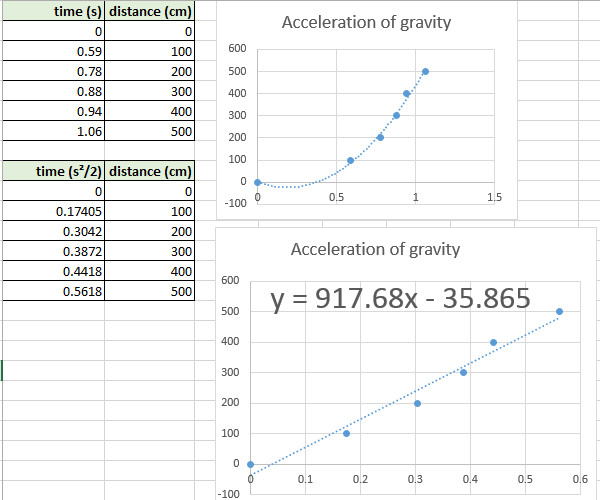
The data in the table and graphs are from a lab three ball dropping experiment.
_______________ _________ According to the data and graphs, what is the acceleration of gravity?
A student rolled marbles into a line of five marbles.
_________ If one marble collides with a line of five marbles on a ruler track, how many marbles are ejected (go out)?
_________ If two marbles collide with a line of five marbles on a ruler track, how many marbles are ejected (go out)?
Why do you think the marbles know what to do? Explain in your own words but do not use "magic" words that you cannot define. Write your answer using complete sentences.
Write Newton's first law of motion.
Write Newton's second law of motion.
Write Newton's third law of motion.
Which law did the "yurt" circle demonstrate and why?
The graph shows pulley data gathered by a student in physical science.
Plot the data provided in the table on the graph below and draw a line through the points.
____________ Based on the data, what is the Actual Mechanical Advantage for the pulley system?
____________ The pulley system had four load lines. What is the Ideal Mechanical Advantage?
____________ Use the preceding two questions to calculate the efficiency of the pulley system.
______________ What was the likely cause of the efficiency being less than 100%?
A student gathered the data seen in the table below.
Plot the soap data on the graph.
__________ __________ Calculate the density of the soap. Include the units with your answer.
Based on the slope, will the soap [float]OR[sink]?
Based on the slope, is this likely to be [Ivory]OR[Dial] soap?
Where does the Amazon jungle get the nutrient phosphorus from?
How does the freezing of ocean water in Antartica contribute to driving global ocean currents?
When a hurricane (typhoon) develops hot towers what does that indicate is going to happen to the storm?
The graph shows the time versus distance data gathered for four different RipStik runs during laboratory 02.
__________ _____ Determine the velocity ѵ of run A.
__________ _____ Determine the velocity ѵ of run B.
__________ _____ Determine the velocity ѵ of run C.
__________ _____ Determine the velocity ѵ of run D.
A RipStik was accelerated from rest (0 cm/s) to 250 cm/s in five seconds.
_______________ _________ Based on the data, what was the acceleration of the RipStik?
_______________ _________ If I continued that same acceleration for ten seconds, how far would I go in centimeters?
Write Newton's first law of motion.
Write Newton's second law of motion.
Write Newton's third law of motion.
The graph shows pulley data gathered by a student in physical science.
Plot the data provided in the table on the graph below and draw a line through the points.
____________ Based on the data, what is the Actual Mechanical Advantage for the pulley system?
____________ The pulley system had four load lines. What is the Ideal Mechanical Advantage?
____________ Use the preceding two questions to calculate the efficiency of the pulley system.
______________ What was the likely cause of the efficiency being less than 100%?
Temperatures in Celsius:
_________℃ What is the temperature of a mix of melting ice and water?
_________℃ What is the temperature of melting solidified coconut oil?
_________℃ What is the typical daily indoor room temperature in Pohnpei?
_________℃ What is the temperature of the healthy living human body?
_________℃ What is the temperature of a boiling water?
Explain the difference between heat and temperature.
Explain the meaning of the following types of heat movement:
Conduction:
Convection:
Radiation:
______________
When walking straight East, which number would change on the GPS unit,
the N 06° 54.566'or the E 158° 09.597' number?
_________ _____ The classroom is at E 158° 09.651'. On Wednesday Binky was at E 158° 09.337'. Use a value of 1820 meters per minute to calculate the distance in meters from the classroom to Binky.
____________________ Plot the data in table two on the graph. Calculate the slope of the line.
A RipStik was swizzled ("wiggled") across a poster paper. The sinusoidal swizzle wave can be seen in the diagram.
_________ How many waves are there on the "paper" above?
λ = _________ _________ What is the wavelength λ of one wave?
a = _________ _________ What is the amplitude a?
τ = _________ _________ What is the period τ of one wave?
f = _________ _________ Calculate the RipStik swizzle wave frequency f.
ѵwave = _________ _________ Use the wavelength λ and frequency f to calculate the velocity ѵwave of the RipStik swizzle wave.
The videos on Monday covered three types of precipitation. List the three types of precipitation and write a definition for each type.
On Tuesday Eiko released the weather balloon with an LMS6 radiosonde attached. List some of the physical properties of the atmosphere that the radiosonde measured.
Define relative humidity.
A student gathered the data seen in the table below.
Plot the data on the graph.
__________ __________ Calculate the experimental speed of sound based on the data. Include the units with your answer.
__________The published value is 349 m/s. Calculate the percentage error for this data.
__________ __________ Based on the experimental data, how long for a sound to travel 615.6 meters?
Primary and secondary colors
List the primary colors of light:
List the secondary colors of light:
In the RGB color number system what do the letters RGB stand for?
HSL colors:
Define Hue:
Define Saturation:
Define Luminosity:
What is the color angle for blue?
What is the color angle for cyan?
What is the name of the computer color system that uses color words such as red, crimson, cyan, antiquewhite, saddlebrown?
What makes up white light?
What happens to the colors that get absorbed?
What is a green house?
What are the seven colors of the Newtonian rainbow?
Which "color" in the Newtonian rainbow does not seem to be a separate, different color?
If you were in charge of replacing the color above in the list of seven rainbow colors, what color would you replace it with?
What is reflection?
What is refraction?
Plot the following data on the graph provided and draw a linear best fit line through the data points on the graph.
______________ Calculate the slope of the linear best fit line. The slope is the experimental index of refraction for the material.
______________ __________ Use the equation of the best fit line above to predict the image depth for a coral head that is 200 cm underwater.
______________ The above material is reported to have a theoretic index of refraction of 1.5. What is the percentage error for the slope you calculated based against a theoretic value of 1.5?
__________ _____ How much current does a Singer 3116 sewing machine use?
__________ _____ What is the voltage for a Singer 3116 sewing machine?
__________ _____ How much power does a Singer 3116 consume?
__________ _____ How much resistance does a Singer 3116 sewing machine generate?
__________ _____ If cash power is $0.47 per kWh, how many hours can the Singer run on 1000 watts of power?
__________ _____ If cash power is $0.47 per kWh, calculate the cost to run the sewing machine for eight hours.
Plot the data below on the graph provided. Draw a best fit trend line through the data.
____________ ________ For the data above, what is the resistance?
__________ What is the atomic number of Zn?
__________ What is the atomic mass of Zn?
__________ How many protons does Zn have?
__________ How many neutrons does Zn have?
__________ How many electrons does Zn have?
____________________ Zn was an element tested in the electrical conductivity, what is the full name for Zn?
Remember that the number of neutrons equals or exceeds the number of protons. The number of protons cannot exceed the number of neutrons in a stable element. Thus the more numerous nucleons are the neutrons.
_______________ Looking only at the atomic diagram, determine the atomic number of the atom depicted.
_______________ Looking at the diagram, what is the atomic mass for the atom?
_______________ Looking at the diagram and the chart on the wall, what is the one or two letter chemical abbreviation for this element?
_______________ Looking at the diagram and the chart on the wall, what is the full name for this element?
_______________ What is the common name for compound with the formula H2O?
_______________ In general, what color do acids tend to turn floral pigment fluids?
_______________ In general, what color do bases tend to turn floral pigment fluids?
_______________ Are lime fruits acid, base, or neutral?
_______________ Is baking soda an acid, base, or neutral?
_______________ Is ammonia an acid, base, or neutral?
_______________ Is a bar of hand soap an acid, base, or neutral?
_______________ Is laundry detergent an acid, base, or neutral?
_______________ Is bleach an acid, base, or neutral?
_______________ Is vinegar an acid, base, or neutral?
_______________ Is cream of tartar an acid, base, or neutral?
_______________ Is water an acid, base, or neutral?
The title of the movie that we had watched is "The Journey to the Edge of the Universe". The journey back to the beginning of time, the moment of creation, begins with a single and simple step. A single step up, just 60 miles up, and we leave the atmosphere of the Earth. Dozens of astronauts have come before us, twelve of those astronauts walked on Earth's nearest satellite, the ___ ___ ___ ___. This video also shows the Neil Armstrong footprints, survived million of years maybe longer than us. It also mention in the movie that our time is limited.
When we first hear the title of the movie we all know that it will talk about or even show what is happening on out planets. So it started out on ___ ___ ___ ___ ___. This planet,they called Morning Star, the Evening Star, and a sister to our planet Earth.It is about the same size of our Earth. Their clouds made up sulphuric acid with carbon dioxide. ___ ___ ___ ___ ___ is one angry Goddess, the air is noxious, unbearable, and hot, approaching 900 degrees. The narrator mention that there is nothing can survive in the planet of ___ ___ ___ ___ ___. It is burning hot and the wind has gone wild, he also mention that this planet was a calm and beautiful planet just like Earth. It was too terrible to look at and too powerful to resist.
Then the second one was ___ ___ ___ ___ ___ ___ ___. In ___ ___ ___ ___ ___ ___ ___, temperature swing wildly at -275 degrees at night. But during in the dayliight, +800 degrees. For size, it has a powerful gravitational pole. It is build up within a huge ball of Iron covered with rocks and core and many other things.
The third one was ___ ___ ___ ___ . They called this planet the Red Planet.It is a giant fossil. It is red and dead that is why they call it a Red Planet. There is wind and when there is wind then there is air. No ozone layer, nothing to protect all the creatures they have in this planet. If they have any. It is hard to believe anything could live here because of the kinds of weather that they have. The life there compare to our life on Earth, they were all way different from one another. On Earth, there are creatures or living things that can survive in our weather. We have cold, hot weather but still we SURVIVED...But in this planet of ___ ___ ___ ___ , we can just say that there is no life in here. There was also this big volcanic mountain and it is 20 times bigger than Mount Everest.
Then we moved on to the gas giant ___ ___ ___ ___ ___ ___ ___. ___ ___ ___ ___ ___ ___ ___ was more than three times size of our Earth. It has mixed colors and these colors. Also in this planet, there is no life in here to grow.
The next planet, ___ ___ ___ ___ ___ ___, it was a giant ball of gas. There were rings made of ice and rocks, some were small just like ice cubes, but some were big. Their gravity works that pulled them together. ___ ___ ___ ___ ___ ___ has a moon called Titan. There was so much to see in this planet. There is an atmosphere. There is wind, "rain", many different seasons, rivers, lakes, and oceans, that looks familiar and similar to our own planet which is Earth. And yet they are completely different: rives, lakes, and oceans of liquid methane, natural gas, an atmosphere with nitrogen but no oxygen. There is no way life can develop in on Titan.
The next planet is ___ ___ ___ ___ ___ ___. The planet is tipped over at a 98 degree angle, the north pole now facing the sun. 42 years of sunlight will strike the north pole until the sun sets as the planet moves around the sun.
Now we are on planet ___ ___ ___ ___ ___ ___ ___. This planet, they called The God of Sea. It is covered in hydrogen, helium, and methane gas. The planet has a storm was as big as our planet Earth. Something else was creating the wind unlike our own planet. The largest moon is Triton.
Beyond there are no more planets. ___ ___ ___ ___ ___ used to be the "ninth planet" but was demoted and is now called a dwarf planet. The surface appears to be frozen water ice and carbon compounds. Beyond the former ninth planet are two more dwarf planets that were covered by the book read in class. The first was named for a Hawaiian goddess, ___ ___ ___ ___ ___ ___, the second for a Rapanui god of Easter island, ___ ___ ___ ___ ___ ___ ___ ___.
At a ___ ___ ___ ___ ___-___ ___ ___ ___, gravity is so intense that not even light can escape.
One of the center of our galaxy, the ___ ___ ___ ___ ___- ___ ___ ___, is either a supermassive black hole or a pair of orbiting black holes.
Sketch a line through the data generated by the class in laboratory fourteen and write an analysis of what types of mathematical models might fit this data.
The graph plots three data sets for three different possible mathematical models for the frisbee data. One data set is plotted as squares, one as circles, and a third as triangles.
__________ Which shape plots data modeled by a linear mathematical trend line model?
__________ Which shape plots data modeled by a non-linear mathematical trend line model?
__________ Which shape plots data that is randomly distributed and cannot be modeled by a trend line model?
__________ For the data that plots linearily, make a mathematical estimate of the slope.
__________ For the data that plots linearily, make a mathematical estimate of the y-intercept.
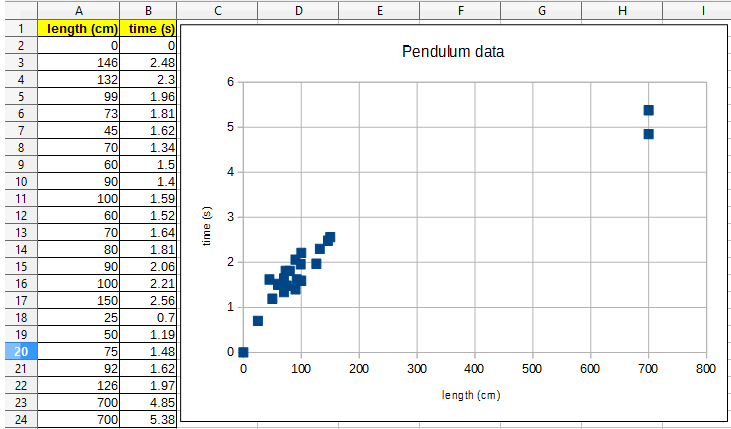
____________________ What mathematical model(s), if any, does your pendulum data appear to obey?
Vera Ruben studied the rotation rate of stars around the centers of galaxies. According to Newton's theory of gravitation, stars closer to the center of the galaxy should be moving more rapidly around the center of the galaxy than stars farther out from the center. Is that what Dr. Rubin found, and if not, what did she find to be true?
Carlos Frenk discovered that without dark matter, computer simulations of the universe did not form galaxies. For galaxies to form, Frenk found which of the following to be true:
(a) Dark matter had to be one fifth the mass of visible matter.
(b) Dark matter had to be equal to the mass of visible matter.
(c) Dark matter had to be five times the mass of visible matter.
The Soudan mine dark matter experiment searched for dark matter particles called ____________________.
________ Does dark matter interact with itself?
More recent research has revealed the existence of dark energy. Dark energy is an unknown source of energy that is causing the universe to expand faster and faster. In the phantom energy theory dark energy will eventually rip the universe apart in an event called the "Big Rip." When will the Big Rip happen?
(a) Before final examinations (b) This summer (c) Within your lifetime (d) Billions of years from now
Does a site swap throw of 3 land in the same hand or the other hand?
Use arrows to trace the path for the ball below for the site swap equation 3 and 51
3:  ___ ___ ___ ___ ___ ___ ___ ___ ___ ___ ___ ___
     R   L   R   L   R   L   R   L   R   L   R   L


51: ___ ___ ___ ___ ___ ___ ___ ___ ___ ___ ___ ___
     R   L   R   L   R   L   R   L   R   L   R   L
Volume V = length l × width w × height h
mass m = density ρ × Volume V
distance d = velocity ѵ × time t
velocity ѵ = acceleration a × time t d = ½at² d = ½gt²
where g is the acceleration of gravity, g = 979 cm/s²
Gravitational Potential Energy GPE = mgh
acceleration of gravity g = 979 cm/s²
Kinetic Energy KE = ½mѵ²
momentum = mass m × velocity ѵ
Force F = mass m × acceleration a
period τ = 1 ÷ (frequency f )
velocity ѵ = wavelength λ * frequency f
 Spring 2013 I was puzzled by a bar of blue Lux Wake Me Up soap. I gathered data and made the chart shown based on the data. The slope was 0.9853 g/cm³. When placed in water the soap sank.