The first graph shows data gathered by a student in SC 130 physical science.
__________ _____ Calculate the density ρ of the soap.
______________ Will the soap floatorsink?
______________ Based on the density and your experience in the laboratory, what brand of soap is this?
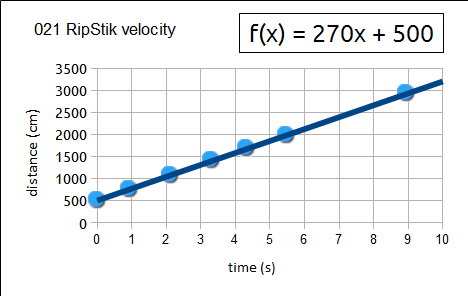
For the following RipStik velocity chart:
__________ _____ Determine the velocity ѵ of the RipStik.
__________ _____ If the RipStik continued at that velocity for 20 seconds, how many centimeters would the RipStik travel?
__________ _____ If the RipStik continued at that velocity for 8600 centimeters, how many seconds would the RipStik travel?
The graph shows RipStik deceleration data. A RipStik was ridden 900 centimeters up a gentle slope, then the RipStik was ridden back down the same slope. The time from the start at the bottom of the slope to the return to the bottom of the slope was 12 seconds.
__________ _____ Calculate the velocity between 0 and 2 seconds.
__________ _____ Calculate the velocity between 2 and 4 seconds.
__________ _____ Determine the velocity at exactly 6 seconds.
__________ _____ Calculate the change in velocity between two and four seconds.
__________ _____ Calculate the acceleration between two and four seconds.
Keeyana starts on a RipStik from a speed of zero at a vertical height of 0.40 meters above the bottom of a slope. The mass of Keeyana and the RipStik is 21 kg. The acceleration of gravity g is 9.79 m/s².
_________ __________ Calculate the Gravitational Potential Energy of Keeyana and the RipStik at the top of the slope.
_________ __________ Use the relationship Kinetic Energy = Gravitational Potential Energy to calculate Keeyana's speed at the bottom of the slope.
_________ __________ Use the velocity to calculate the momentum of Keeyana and the RipStik at the bottom of the slope.
The graph shows momentum data gathered by a student in physical science. The momentum was calculated by multiplying the mass of the marble by the velocity of the marble for the inbound and outbound marble.
Plot the data provided in the table on the graph below and draw a line through the points.
_________ __________ Calculate the slope of the line.
_________ __________ Determine the y-intercept of the line.
___________ What percent of momentum was retained?
___________ What percent of momentum was lost?
Why was momentum lost?
Write out Newton's first law of motion in words.
Write Newton's second law.
Write Newton's third law.
force (gmf)
load (gmf)
20
90
80
360
140
630
180
810
The data are measurements made for a five load line pulley.
____________ Based on the data, what is the Actual Mechanical Advantage for the pulley system?
____________ The pulley system had five load lines. What is the Ideal Mechanical Advantage?
____________ Use the preceding two questions to calculate the efficiency of the pulley system.
Temperatures in Celsius:
_________℃ What is the temperature of a mix of melting ice and water?
_________℃ What is the temperature of melting solidified coconut oil?
_________℃ What is the typical daily indoor room temperature in Pohnpei?
_________℃ What is the temperature of the healthy living human body?
_________℃ What is the temperature of a boiling water?
______________
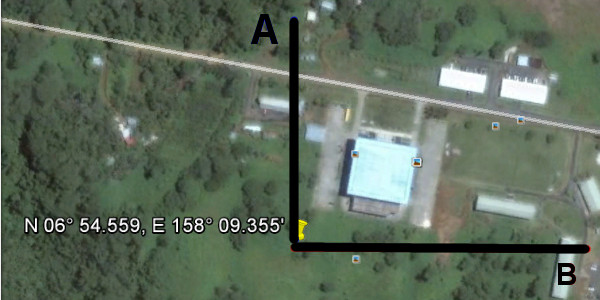
When walking straight East, which number would change on the GPS unit,
the N 06° 54.566'or the E 158° 09.597' number?
_________ _____ The classroom is at E 158° 09.651'. On Wednesday Dana was at E 158° 09.309'. Use a value of 1820 meters per minute to calculate the distance in meters from the classroom to Dana.
Spring term 2014 I hid at N 06° 54.559', E 158° 09.355'. The lines of latitude and longitude are shown in the picture. One line is labeled A and the other line is labeled B. North is at the top of this image.
_____ Which letter in the image corresponds to a line of latitude?
_____ Which letter in the image corresponds to a line of longitude?
_____ Which letter in the image corresponds to the line that is N 06° 54.559'?
_____ Which letter in the image corresponds to the line that is E 158° 09.355'?
Volume V = length l × width w × height h
mass m = density ρ × Volume V
distance d = velocity ѵ × time t
ѵ = at ѵ = gt d = ½at² d = ½gt²
where g is the acceleration of gravity g = 979 cm/s²
Gravitational Potential Energy GPE = mgh
acceleration of gravity g = 980 cm/s²
Kinetic Energy KE = ½mѵ²
 Keeyana starts on a RipStik from a speed of zero at a vertical height of 0.40 meters above the bottom of a slope. The mass of Keeyana and the RipStik is 21 kg. The acceleration of gravity g is 9.79 m/s².