The first graph shows data gathered by a student in SC 130 physical science.
__________ _____ Calculate the density ρ of the soap.
______________ Will the soap floatorsink?
______________ Based on the density and your experience in the laboratory, what brand of soap is this?
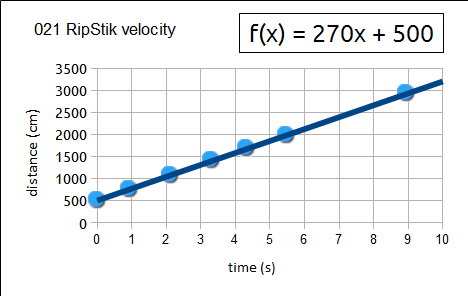
For the following RipStik velocity chart:
__________ _____ Determine the velocity ѵ of the RipStik.
__________ _____ If the RipStik continued at that velocity for 20 seconds, how many centimeters would the RipStik travel?
__________ _____ If the RipStik continued at that velocity for 8600 centimeters, how many seconds would the RipStik travel?
__________ _____ A superball falls for four seconds. How far does the superball fall in centimeters? Use 979 cm/s² for the acceleration of gravity.
__________ _____ A superball falls for four seconds. What is the speed of the superball?
__________ _____ A superball falls from 700 centimeters high. How long does the superball fall in seconds?
__________ _____ A superball falls from 700 centimeters. What is the speed of the superball?
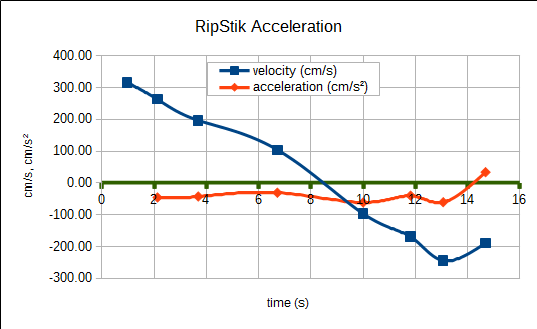
The graph shows RipStik deceleration data. A RipStik was ridden 900 centimeters up a gentle slope, then the RipStik was ridden back down the same slope. The time from the start at the bottom of the slope to the return to the bottom of the slope was 12 seconds.
__________ _____ Calculate the velocity between 0 and 2 seconds.
__________ _____ Calculate the velocity between 2 and 4 seconds.
__________ _____ Determine the velocity at exactly 6 seconds.
__________ _____ Calculate the change in velocity between two and four seconds.
__________ _____ Calculate the acceleration between two and four seconds.
For the following RipStik velocity and acceleration versus time chart explain, in your own words, the physical science meaning behind the constant decrease in velocity from one to twelve seconds.
distance d = velocity ѵ × time t
ѵ = at ѵ = gt d = ½at² d = ½gt²
where g is the acceleration of gravity g = 979 cm/s²