- __________ Calculate the slope.
- ______________ Write the units for the slope.
- ______________ Determine the y-intercept.
- ____________________________ Write the y = mx + b slope-intercept equation.
- Plot the data.
- __________ __________ Calculate the slope of the line.
- __________ __________ Calculate the intercept of the line.
- __________ __________ Calculate the distance in meters for 0.080 minutes.
- __________ __________ Calculate the distance in minutes for 1260 meters.
- __________ _____ What is the volume of the soap?
- __________ _____ What is the density of the soap?
- ______________ Will the soap float or sink?
- __________ _____ How long does the superball fall in seconds?
- __________ _____ What is the speed of the superball?
- __________ _____ Determine the velocity at exactly 6 seconds.
- __________ _____ Calculate the velocity between 8 and 10 seconds.
- __________ _____ Calculate the velocity between 10 and 12 seconds.
- __________ _____ Calculate the acceleration between 10 and 12 seconds.
The student gathered the following data:
Slow marble in: distance = 24 cm, time = 1.2 seconds.
Slow marble out: distance = 24 cm, time = 1.6 seconds.
Fast marble in: distance = 24 cm, time = 0.75 seconds.
Fast marble out: distance = 24 cm, time = 1.0 seconds.
Faster marble in: distance = 24 cm, time = 0.6 seconds.
Faster marble out: distance = 24 cm, time = 0.8 seconds.
- Use the data above to calculate the velocity in and the velocity out. Record the velocities in the table below.
- _________ __________ Calculate the slope of the line.
- _________ What was the percentage loss in velocity?
- __________________ __ ______________ What physical law was the above experiment intended to demonstrate?
- _________ __________ Calculate the Gravitational Potential Energy of the child and RipStik at the top of the slope.
- _________ __________ Use the relationship Kinetic Energy = Gravitational Potential Energy to calculate the speed of the child and the RipStik at the bottom of the slope.
- _________ __________ Use the velocity to calculate the momentum of the child and RipStik at the bottom of the slope.
| force (gmf) | load (gmf) |
|---|---|
| 20 | 66 |
| 80 | 264 |
| 140 | 462 |
| 180 | 594 |
- ____________ What is the actual mechanical advantage?
- ____________ The pulley system had four load lines. What is the ideal mechanical advantage?
- ____________ Calculate the efficiency.
- _________℃ What is the temperature of a mix of melting ice and water?
- _________℃ What is the typical daily indoor room temperature in Pohnpei?
- _________℃ What is the temperature of the healthy living human body?
- _________℃ What is the temperature of a boiling water?
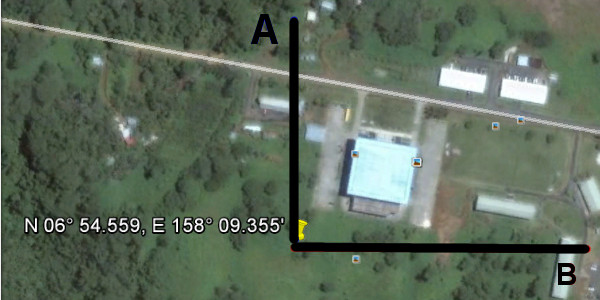 Spring term 2014 I hid at N 06° 54.559', E 158° 09.355'. The lines of latitude and longitude are shown in the picture. One line is labeled A and the other line is labeled B. North is at the top of this image.
- _____ Which letter in the image corresponds to a line of latitude?
- _____ Which letter in the image corresponds to a line of longitude?
- _____ Which letter in the image corresponds to the line that is N 06° 54.559'?
- _____ Which letter in the image corresponds to the line that is E 158° 09.355'?
- _________ How many wavelengths are shown?
- λ = _________ _________ Calculate the wavelength λ of one wave in centimeters.
- a = _________ _________ Calculate the amplitude a.
- τ = _________ _________ Calculate the period τ.
- f = _________ _________ Calculate the RipStik swizzle wave frequency f.
- What are the three primary colors of light?
- Define HSL Hue:
- Define HSL Saturation:
- Define HSL Luminosity:
 For a Singer Heavy Duty 4423 sewing machine with information as provided in the image:
- __________ _____ What voltage does the machine use?
- __________ _____ How much current does the machine use?
- __________ _____ Calculate the electrical power used by the machine.
- __________ _____ Calculate the electrical resistance.
- __________ _____ If cash power costs $0.60 per kiloWatt hour, what is the cost to run the machine for eight hours?
- __________ What is the atomic number of Cu?
- __________ What is the atomic mass of Cu?
- __________ How many protons does Cu have?
- __________ How many neutrons does Cu have?
- __________ How many electrons does Cu have?
- ____________________ Cu was an element tested in the electrical conductivity, what is the full name for Cu?
- _______________ Looking only at the diagram of the atom, determine the atomic number of the atom depicted.
- _______________ Looking at the diagram, what is the atomic mass for the atom?
- _______________ Looking at the diagram and the chart on the wall, what is the one or two letter chemical abbreviation for this element?
- On a journey from Earth to the Sun, we first encounter the goddess of love, the planet ____________.
- This goddess, however, is an angry goddess, the sister planet from hell, due to a runaway ____________ ____________ effect.
- Continuing our journey to the Sun we meet the burnt and frozen innermost planet, ____________.
- Beyond Jupiter is the planet known as the ringed planet, ____________.
- Beyond Uranus is the last planet, ____________.
- On our way to the edge of the universe we eventually leave our galaxy, called the ____________ ____________.
- Two billion light years from the Earth and two billion years back in time we see galaxies that are brighter than a thousand galaxies today, these are called ____________.
- _____ Identify by the letter which of the mathematical relationships on the graph represents the time versus distance relationship for a RipStik moving at a constant linear velocity with no acceleration (as in the homework 021 in the second week).
- _____ Identify by the letter which of the mathematical relationships on the graph represents the time versus distance relationship for a ball falling under the constant acceleration of gravity g (as in laboratory three).
- _____ Identify by the letter which of the mathematical relationships on the graph represents the height versus velocity relationship for a marble rolling from a height h down a banana leaf and onto a flat table (homework 041).
- _____ Identify by the letter which of the mathematical relationships on the graph represents the length versus mass for a cantilever (as last Friday in class, homework 054).