psd3 024 ☈ Name:
distance d = velocity ѵ × time t
- The graph shows the time versus distance data gathered for four different ball speeds in laboratory 02.
- __________ _____ Determine the velocity ѵ of ball A.
- __________ _____ Determine the velocity ѵ of ball B.
- __________ _____ Determine the velocity ѵ of ball C.
- __________ _____ Determine the velocity ѵ of ball D.
- __________ _____ Calculate the velocity ѵ of a ball that rolls 2424 centimeters in six seconds.
- __________ _____ Calculate the distance a ball with a velocity ѵ of 777 cm/s will roll in six seconds.
- __________ _____ Calculate the time for a ball with a velocity ѵ of 243 cm/s to roll 729 centimeters.
- For the following RipStik velocity data and chart:
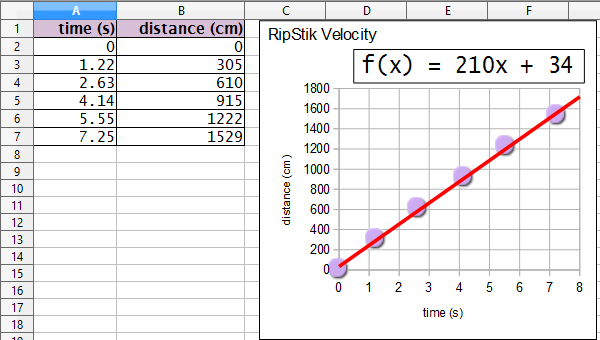
- __________ _____ Determine the velocity ѵ of the RipStik.
- __________ _____ If the RipStik continued at that velocity for 60 seconds, how many centimeters would the RipStik travel?
- __________ _____ If the RipStik continued at that velocity for 1819 centimeters, how many seconds would the RipsStik travel?
- The five graphs seen below plot time versus distance for a rolling ball. Time in seconds is on the x-axis. Distance in centimeters is on the y-axis.
- Explain what is happening with the speed of ball A.
- Explain what is happening with the speed of ball B.
- Explain what is happening with the speed of ball C.
- Explain what is happening with the speed of ball D.
- Explain what is happening with the speed of ball E.