The first graph shows data gathered by a student in SC 130 physical science.
__________ Calculate the slope of the line.
______________ Write the units for the slope of the line.
______________ Determine the y-intercept of the line.
____________________________ Write the slope-intercept equation for the line.
The second graph shows velocity data gathered by a student in physical science.
Plot the data.
__________ __________ Calculate the slope of the line.
__________ __________ Calculate the intercept of the line.
__________ __________ Based on the slope and intercept, how many meters in one minute?
__________ What is the slope of the line y = 5.5 + 0.85x?
__________ What is the y-intercept of the line y = 5.5 + 0.85x?
__________ _____ A student measures a bar of soap with a length of 8.0 cm, a width of 5.4 cm, and a height of 2.6 cm. What is the volume of the soap?
__________ _____ A student measures a bar of soap with a length of 8.0 cm, a width of 5.4 cm, and a height of 2.6 cm. The soap has a mass of 88.0 grams. What is the density of the soap?
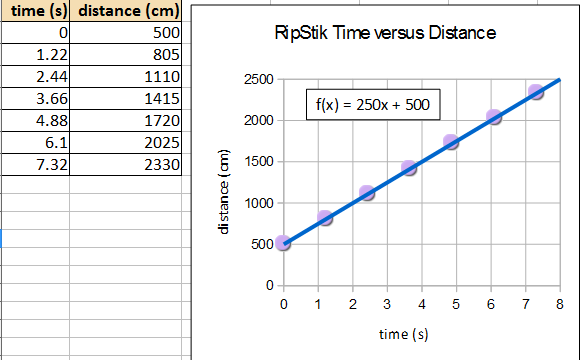
The left graph is time versus distance for echoes in laboratory seven. The right graph is time versus distance for moving RipStik castor boards.
For the speed of sound graph:
_________ _________ Based on the left graph, what is the experimental speed of sound?
For the RipStik Data graph and the lines on that graph:
_____ Which letter labels the RipStik not moving, stationary?
_____ Which letter labels the RipStik moving at a constant speed, no acceleration?
_____ Which letter labels the RipStik moving faster at a constant rate of acceleration?
_____ Which letter labels the RipStik moving with a non-constant deceleration?
_______ ___________ Determine the speed of RipStik run C.
_______ ___________ Determine the speed of RipStik run D.
_______ ___________ Determine the speed of RipStik run B from 0 to 1 second.
_______ ___________ Determine the speed of RipStik run B from 2 to 5 seconds.
_______ ___________ For RipStik run A:
distance = ½*acceleration*time².
The coordinate shown on the graph as a square on line A is at (3 s, 900 cm). Using the equation and the coordinate, calculate the value of the acceleration a.
Short form of the same equation: d=½at²
For the following RipStik velocity data and chart
__________ _____ Given the equation d = 250t + 500, determine the velocity ѵ of the RipStik.
__________ _____ If the RipStik continued at that velocity for 60 seconds, how far would the RipStik go?
__________ _____ If the RipStik continued at that velocity for 5,000 centimeters, how long in seconds would it take the RipStik?
A marble with a mass of 5 grams sits on a banana leaf 10 centimeters vertically above the table. The acceleration of gravity g of 980 cm/s².
_________ __________ Calculate the Gravitational Potential Energy of the marble.
_________ __________ At the bottom of the banana leaf the same marble is moving at a velocity of 100 cm/s. Calculate the Kinetic Energy of the marble.
______________ As a percentage of the original Gravitational Potential Energy, how much energy was lost to friction and other sources of energy loss?
__________ __________ A RipStik was accelerated using a force of 30 Newtons. The mass of the RipStik and the rider was 60 kilograms. Calculate the acceleration of the RipStik.
Temperatures in Celsius:
_________℃ What is the temperature of a mix of melting ice and water?
_________℃ What is the temperature of the healthy living human body?
_________℃ What is the temperature of a boiling water?
______________
When walking straight East, which number would change on the GPS unit,
the N 06° 54.566'or the E 158° 09.597' number?
_________ _____ The classroom is at E 158° 09.651'. On Wednesday Dana was at E 158° 09.355'. Use a value of 1820 meters per minute to calculate the distance from the classroom to Dana.
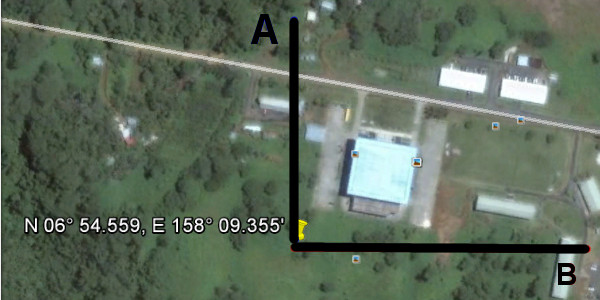
On Wednesday I hid at N 06° 54.559', E 158° 09.355'. The lines of latitude and longitude are shown in the picture. One line is labeled A and the other line is labeled B. North is at the top of this image.
_____ Which letter in the image corresponds to a line of latitude?
_____ Which letter in the image corresponds to a line of longitude?
_____ Which letter in the image corresponds to the line that is N 06° 54.559'?
_____ Which letter in the image corresponds to the line that is E 158° 09.355'?
A RipStik was swizzled ("wiggled") across a poster paper. The sinusoidal swizzle wave can be seen in the diagram below along with the measurements.
_________ How many wavelengths are shown?
λ = _________ _________ Calculate the wavelength λ of one wave in centimeters.
a = _________ _________ Calculate the amplitude a.
τ = _________ _________ Calculate the period τ.
f = _________ _________ Calculate the RipStik swizzle wave frequency f.
ѵwave = _________ _________ Use the wavelength λ and frequency f to calculate the velocity ѵwave of the RipStik swizzle wave.
Newton's first law states:
Newton's second law states:
Newton's third law states:
The four fundamental forces are the electromagnetic force, strong atomic force, weak atomic force and the:
_______ Using the chart on the wall determine the number of neutrons for the fifth element,
List the six primary and secondary colors of light:
List the seven colors of the Newtonian rainbow spectrum in order:
List the eight planets in order from the sun outwards:
A pulley system has nine load lines.
__________ What is the ideal mechanical advantage for a pulley system with nine load lines?
__________ What is the actual mechanical advantage for a pulley system with nine load lines that lifts a load of a load of 900 grams using a force of 200 grams?
__________ Calculate the efficiency of the pulley system.
__________ _____ For a Brother XR-7700 sewing machine, calculate the power used based on the information in the image.
__________ _____ For a Brother XR-7700 sewing machine, calculate the resistance.
What is reflection?
What is refraction?
_______________ Looking only at the atomic diagram, determine the atomic number of the atom depicted.
_______________ Looking at the diagram, what is the atomic mass for the atom?
_______________ Looking at the diagram and the chart on the wall, what is the one or two letter chemical abbreviation for this element?
_______________ Looking at the diagram and the chart on the wall, what is the full name for this element?
_______________ What is the common name for compound with the formula H2O?
_______________ Are lime fruits acid, base, or neutral?
_______________ Is baking soda an acid, base, or neutral?
_______________ Is water an acid, base, or neutral?
The graph plots three data sets for three different possible mathematical models. One data set is plotted as squares, one as circles, and a third as triangles.
__________ For the data that plots linearily, make a mathematical estimate of the slope.
__________ For the data that plots linearily, make a mathematical estimate of the y-intercept.
Vol. V = length l × width w × height h
mass m = density ρ × Volume V
d = ѵt
ѵ = at d = ½at² d = ½gt² g = 980 cm/s² Gravitational Potential Energy GPE = mgh
Kinetic Energy KE = ½mѵ²
momentum = mass m × velocity ѵ
Force F = mass m × acceleration a
Actual Mech Adv = Load lifted ÷ Force used to lift
period τ = 1 ÷ (frequency f )
velocity ѵ = wavelength λ * frequency f