The graph shows pulley data gathered by a student in physical science.
Plot the data provided in the table on the graph below and draw a line through the points.
____________ Based on the data, what is the Actual Mechanical Advantage for the pulley system?
____________ The pulley system had four load lines. What is the Ideal Mechanical Advantage?
____________ Use the preceding two questions to calculate the efficiency of the pulley system.
______________ What was the likely cause of the efficiency being less than 100%?
____________ During a RipStik ride in the classroom I held a ball in the palm of my outstretched hand. The ball and I were moving at a constant speed and then I suddenly stopped. The ball kept going. Which of Newton's laws explains why the ball kept going?
_____________ Which of Newton's law governs the accelerating motion of a RipStik?
__________ __________ A RipStik was accelerated using a force of 15 Newtons. The mass of the RipStik and the rider was 75 kilograms. Calculate the acceleration of the RipStik.
Temperatures in Celsius:
_________℃ What is the temperature of a mix of melting ice and water?
_________℃ What is the temperature of melting solidified coconut oil?
_________℃ What is the typical daily indoor room temperature in Pohnpei?
_________℃ What is the typical daily sunny day outdoor temperature in Pohnpei?
_________℃ What is the temperature of the healthy living human body?
_________℃ What is the temperature of a boiling water?
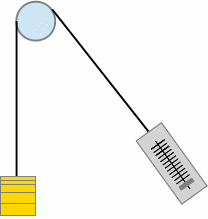
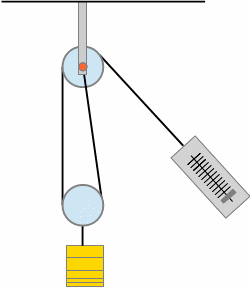
For the following pulley systems, write on the picture the Ideal Mechanical Advantage for each system:
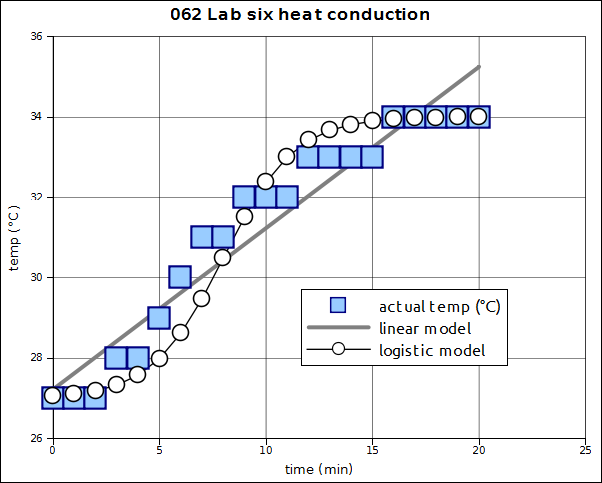
The following xy scattergraph plots heat conduction temperature plotted as squares. The linear line is the best fit trend line mathematical model. The round circles are a mathematical model called a logistic model.
Linear mathematical model: temperature = 0.40*time + 27.23
Logistic mathematical model:
______________________ Which mathematical model best fits the data, the linearor the logistic model?