- For the Soap Density graph:
- __________ _____ Calculate the density ρ of the soap.
- ______________ Will the soap float or sink?
- For the RipStik Data graph and the lines on that graph:
- _____ Which letter labels the RipStik not moving, stationary?
- _____ Which letter labels the RipStik moving at a constant speed, no acceleration?
- _____ Which letter labels the RipStik moving faster at a constant rate of acceleration?
- _____ Which letter labels the RipStik moving with a non-constant deceleration?
- _______ ___________ Determine the speed of RipStik run C.
- _______ ___________ Determine the speed of RipStik run D.
- _______ ___________ Determine the speed of RipStik run B from 0 to 1 second.
- _______ ___________ Determine the speed of RipStik run B from 2 to 5 seconds.
- _______ ___________ For RipStik run A:
distance = ½*acceleration*time².
The coordinate shown on the graph as a square on line A is at (3 s, 900 cm). Using the equation and the coordinate, calculate the value of the acceleration a.
Short form of the same equation: d=½at²
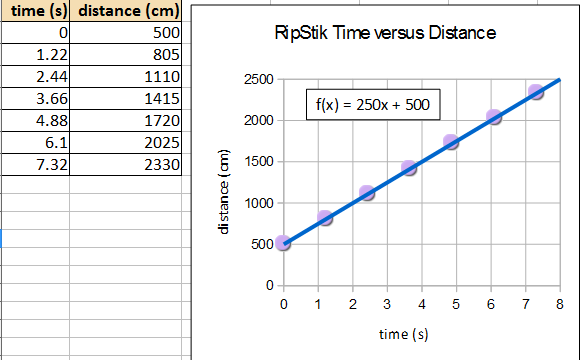
- __________ _____ Given the equation d = 250t + 500, determine the velocity ѵ of the RipStik.
- __________ _____ If the RipStik continued at that velocity for 60 seconds, how far would the RipStik go?
- __________ _____ If the RipStik continued at that velocity for 5,000 centimeters, how long in seconds would it take the RipStik?
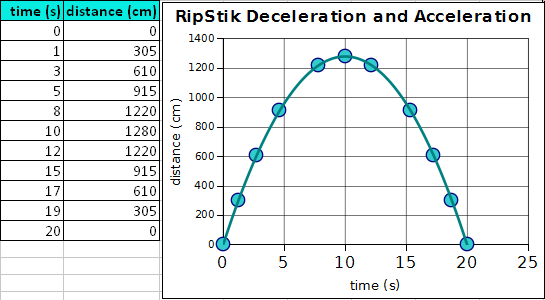
- ___________________ What is the name of the shape formed by the curve on the graph?
- ___________________ Between zero and ten seconds, what is happening to my velocity?
- ___________________ At exactly ten seconds, what is my velocity according to the graph?
- ___________________ Between ten and twenty seconds, what is happening to my velocity?
- ___________________ During the twenty second run, is the direction of the force on the RipStik changing?

- __________ _____ What is the volume of the soap?
- __________ _____ What is the density of the soap?
- __________ _____ What will be the slope of the volume (cm³) versus mass (g) line on an xy scattergraph of volume versus mass for the Lux soap?
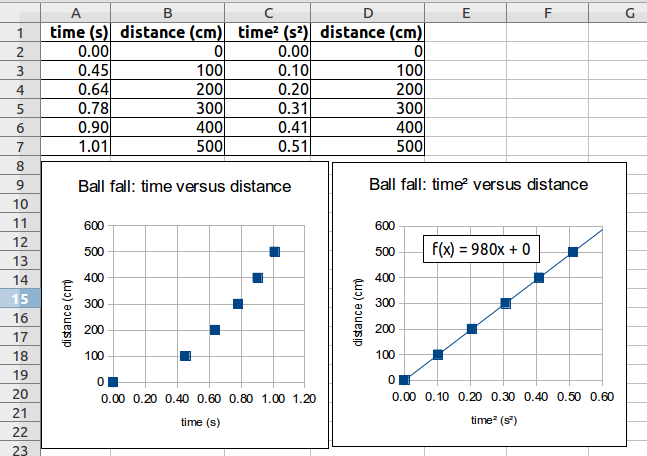
_______________ _________ According to the data and graphs, what is the acceleration of gravity?