The graph shows the time versus distance data gathered for four different ball speeds in laboratory 02.
__________ _____ Calculate the velocity ѵ of ball A.
__________ _____ Calculate the velocity ѵ of ball B.
__________ _____ Calculate the velocity ѵ of ball C.
__________ _____ Calculate the velocity ѵ of ball D.
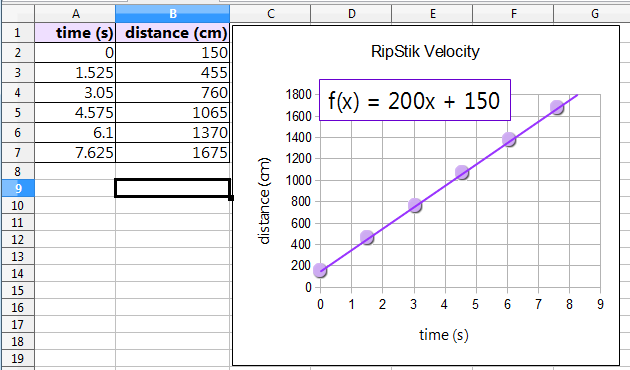
For the following RipStik velocity data and chart
__________ _____ Calculate the velocity ѵ of the RipStik.
__________ _____ If the RipStik continued at that velocity for 60 seconds, how far would the RipStik go?
__________ _____ If the RipStik continued at that velocity for 10,000 centimeters, how long in seconds would it take the RipStik?
A rolling ball cannot generate a vertical line on a time versus distance graph. Why?
[The following includes formulas written in MathML. FireFox or Safari browsers must be used to render the formulas correctly.]
y = mx + b
Where m is the slope and b is the y-intercept
distance d = velocity ѵ × time t d = ѵt
If there is a y-intercept: d = ѵt + b
where b is in the units of distance