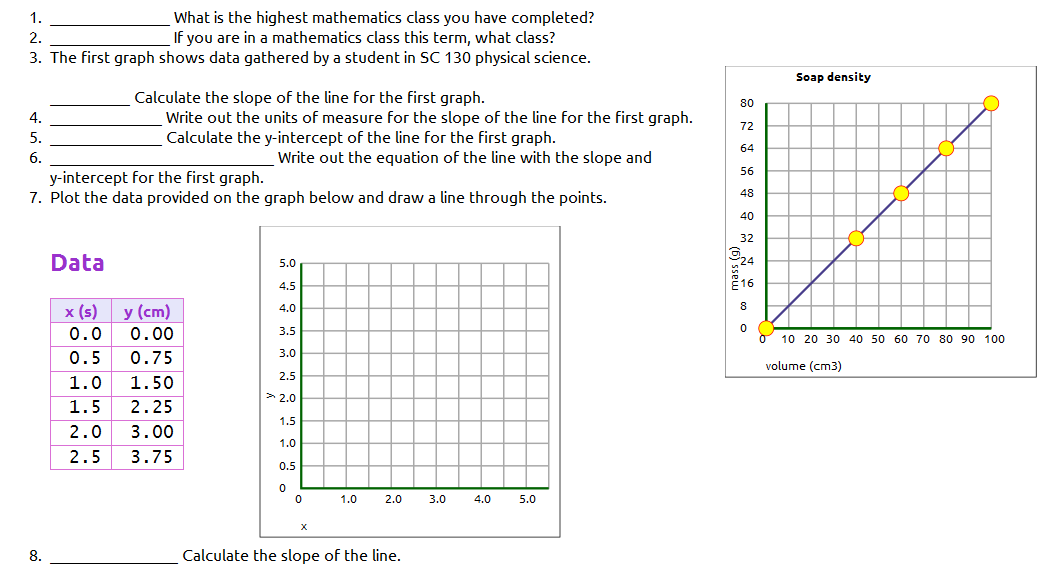
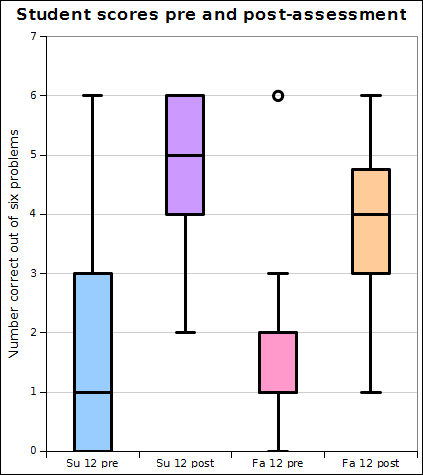
The second program learning outcome which SC 130 Physical Science addresses is "Students will be able to present and interpret numeric information in graphic forms." The sixteen students in physical science summer term 2012 and 30 students fall term 2012 were given six questions which focused on this outcome.
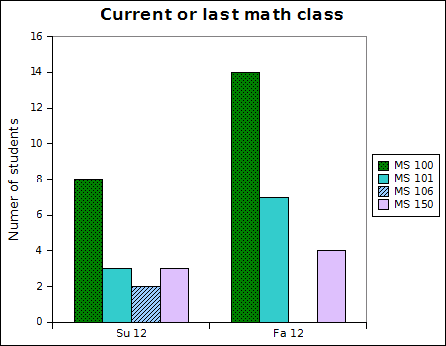
The students in the course have either taken college algebra or are in college algebra or a higher math class. For the summer session, student scores on the six questions improved significantly. Fall term the students scored weakly on the preassessment, improvement was not as strong as summer term. This pattern, where mastery of material is better in the summer, is a familiar one in my courses at the college. Students have fewer classes in the summer, the classes meet every day, and the span of time over which material is presented is highly compressed. Even so, the students improved strongly fall 2012. The chart on the right is a box plot, questions one and two are not included in this analysis.
Improvement by item is displayed in the following chart. The left end of the bar is the percent of students answering that item correctly at term start. The right end of the bar is the percent of the students answering that item correctly at term end.
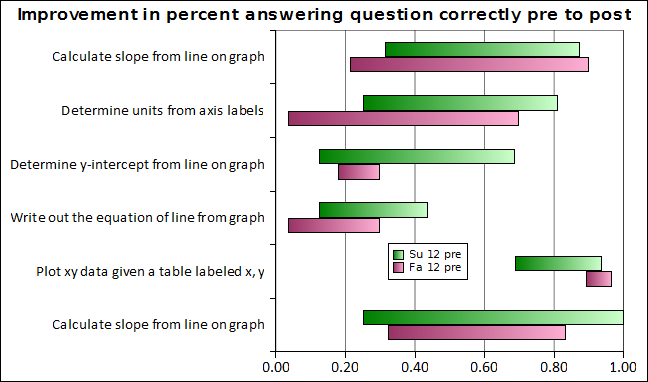
Identification of the y-intercept proved problematic fall 2012, both on the preassessment and the postassessment. This led to incorrect equations of the line.
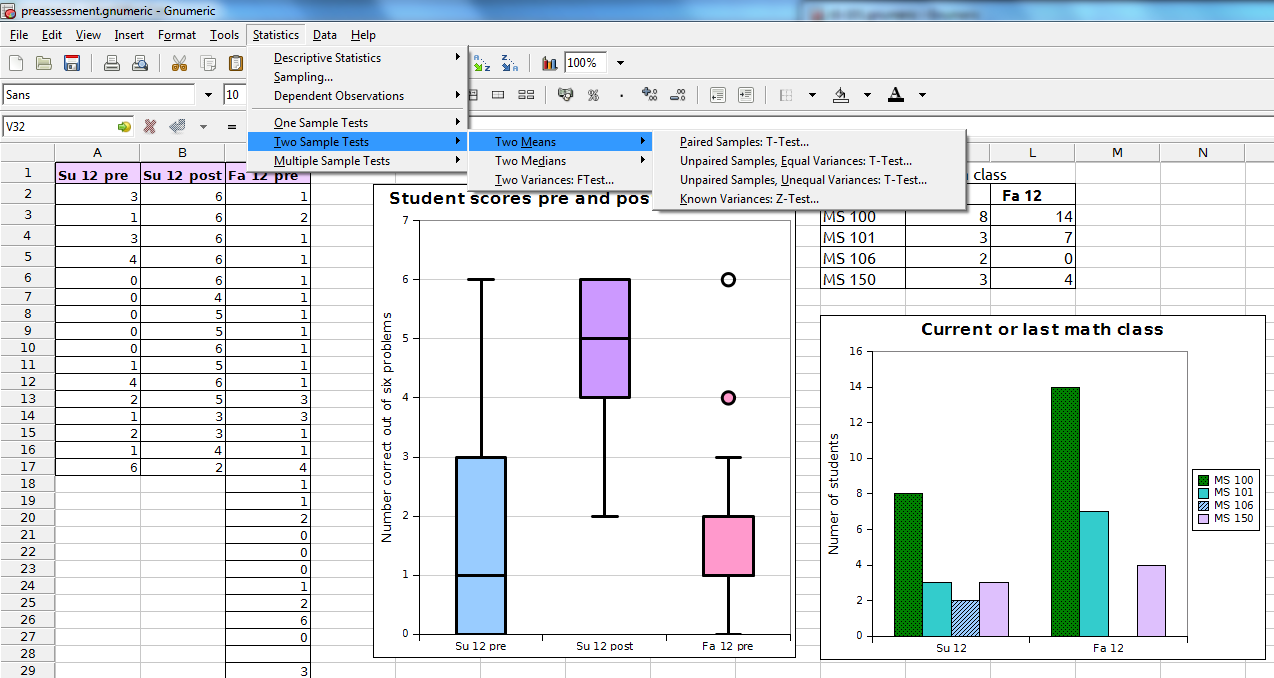
All charts produced with Gnome Gnumeric, a cross-platform, open-source, free spreadsheet package with statistical analysis capabilities built-in.