 There exists a mathematical relationship between the drop height and the bounce height for a ball.
Do NOT use this page as your lab starter. Use the lab starter page instead!
The laboratory is the midterm practical examination laboratory. In this laboratory I intentionally provide considerably less guidance on the specifics of the procedure, table design, chart type, and analysis.
There exists a mathematical relationship between the drop height and the bounce height for a ball.
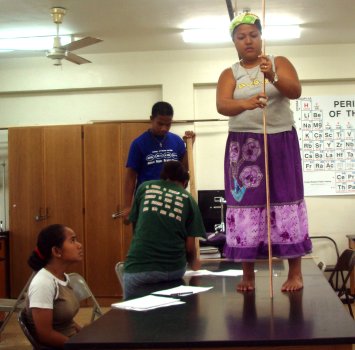
Yahne and Ivyleen chose to drop their ball on the table. If nothing else, my students are comfortable in the laboratory and willing to stand on furniture. Yahne and Ivyleen opted, of their own accord, to go beyond one meter.
Maverick and Claire working with drop heights of less than one meter.

Produce a table of drop heights and their corresponding bounce heights.
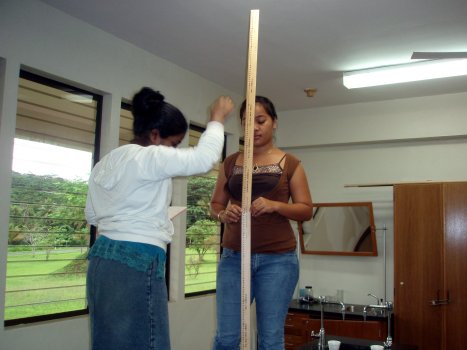
Vishani drops the ball while Renee holds the meter sticks.
Make a chart appropriate to displaying the mathematical relationship between drop height and bounce height.
RS and Teine record results

Report the slope and intercept of a best fit line to your data. Does the data appear to be well modeled by a linear mathematical relationship? If not linear, is there a relationship? If you were given a drop height, could you calculate a bounce height?
Wrap up with a conclusion that discusses whether there is a mathematical relationship and, if so, then the nature of that relationship. Write well. Grammar, Vocabulary, Organization, and Cohesion will still be marked.