MS 101 Alg & Trig test seven preview edition •
Name:
Wave equation in terms of wavelength λ and distance x:
Wave equation in terms of period τ and time t:
Period τ and frequency f relationship:
The first graph shows data gathered by a student in SC 130 physical science.
__________ Calculate the slope of the line.
______________ Determine the y-intercept of the line.
____________________________ Write the slope-intercept equation for the line.
The second graph shows velocity data gathered by a student in physical science.
Plot the data.
__________ __________ Calculate the slope of the line.
__________ __________ Calculate the intercept of the line.
__________ __________ Based on the slope and intercept, 1.000 minutes is how many meters?
__________ __________ Based on the slope and intercept, 200 meters is how many minutes?
__________ What is the slope of the line y = 5.5 + 0.85x?
__________ What is the y-intercept of the line y = 5.5 + 0.85x?
Write the function to predict the number of descendants in generation x for a family in which each and every child in every generation has five children.
Use a spreadsheet to make an xy scatter graph of the following ball bounce data.
Bounce number
Bounce height (cm)
0
100
2
45
4
20
6
9
8
4
10
2
Add an EXPONENTIAL trend line and equation to the graph. Write the exponential equation below:
__________ Based on the exponential equation in part a, what will be the height of bounce number twelve?
__________ A ball bounce function is given by f(x) = 100 × (0.80)n where n is the bounce number and f(x) is the bounce height. Calculate the height of the ninth bounce by evaluating this function at n = 9.
Circle the exponential equation: y = 2x | y = x2 | y = 2x
__________ Evaluate 7x for x = 0
__________ Evaluate 7x for x = 3
__________ Evaluate ex for x = 3.8066625
__________ Evaluate log10(x) for x = 10,000
__________ Evaluate log10(x) for x = 500
__________ Evaluate lne(x) for x = 2.71828
__________ Evaluate lne(x) for x = 0
Use a spreadsheet to make an xy scatter graph of the following baby growth data.
age in months post-conception
weight (pounds)
9
6.6
9.5
7.5
11.5
11
13.3
13
14.2
14
15
14.5
17.5
15.4
21
20
25
18
26
17.6
27
19.4
37
23.1
57
29
Add a LOGARITHMIC trend line and equation to the graph. Write the logarithmic equation below:
____________ Based on the logarithmic equation in part a, calculate the weight of the baby at 33 months post-conception.
____________ Based on the logarithmic equation in part a, calculate the age in months post-conception when the weight will be equal to 30 pounds.
Mathematically, why cannot the baby be started at an age of zero months?
____________ e0
____________ ln e
____________ log 100
____________ ex = 20.0856
____________ ln x = 1.60944
____________ log x = 0.90309
____________ 5 ln 8x = 23.22196
____________
____________ ln(2) + ln (17) = ln x
____________ ex = e50 * e5
____________ 101.949391
____________
The following chart displays three functions. Each function is shown using a marker of a different shape: circles, squares, and triangles.
__________ What marker shape would best represent the exponential function f(x)=ex?
__________ What marker shape would best represent the exponential function f(x)=e−x?
__________ What marker shape would best represent a logistic function?
"A learning curve is a graphical representation of the increase of learning (vertical axis) with experience (horizontal axis). The curve for a single subject may be erratic." - Learning curve. (2013, June 11). In Wikipedia, The Free Encyclopedia. Retrieved 09:59, June 11, 2013 In a learning curve experiment a young girl was introduced to riding a RipStik for the first time. On her very first attempt to ride the RipStik she fell off immediately, a rolling time of zero seconds. On her second attempt she fell off in three seconds. The attempts to ride are experience, the time during which she successfully rolled is the learning.
Experience: Attempt number
Learning: Rolling time (s)
1
0
2
3
3
4
4
3.5
5
8.5
6
6
7
5.8
8
9
9
9
10
7.9
11
8.3
12
10.4
13
9.3
14
10.6
15
10.1
16
11
17
12
Graph the data, add a LOGARITHMIC trend line and equation to the graph, and then write the logarithmic equation:
____________ Based on the logarithmic equation in part a, calculate the rolling time for attempt number 22.
____________ Based on the logarithmic equation in part a, calculate the attempt number when the young girl will attain a rolling time of 16 seconds.
Solve the equation in part a for x, writing out the resulting inverse equation below:
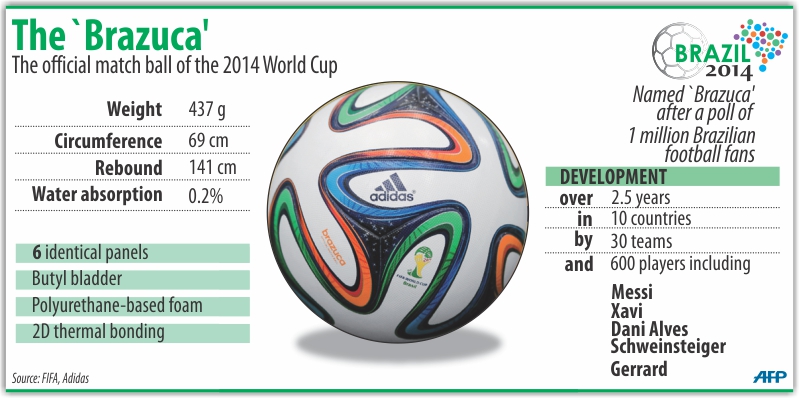
Use a spreadsheet to make an xy scatter graph of the following speed versus coefficient of drag data for a Brazuca soccer ball. Note that the actual function for the coefficient of drag is not logarithmic. A logarithmic curve is being used for the purposes of this test only.
Speed (km/hour)
Coefficient of drag
23
0.49
40
0.40
47
0.20
62
0.18
123
0.20
Add a LOGARITHMIC trend line and equation to the graph. Write the logarithmic equation below:
__________ Based on the logarithmic equation in part a, what will be the coefficent of drag at 100 kilometers per hour?
__________ Based on the logarithmic equation in part a, at what speed will the coefficient of drag be 0.30?
Either make the calculation or solve for x as appropriate. Round answers to two decimal places.
____________ log71
____________ ln x = 1.0986123
____________ log 2 + log 3 = log x
____________ log x = 1
____________
____________ logx21=1
____________ ln(x − 7) = 3.04452244
____________
_________ Using a 45 foot long rope, Tommy in the center, Jamal walking in a circle with the rope taut, Maybelline would measure a length of 283 feet. Calculate the value of pi based on this data.
_________ The curve on a 400 meter track is roughly 100 meters long. What is the radius of this curve in meters?
_________ Convert radians to degrees.
_________ Convert 45° to radians expressed as π over a number.
_________ Calculate: 100 sin(60°)
_________ Calculate: 100 cos(30°)
_________ Calculate: 200 sin(45°)
_________ Calculate: 200 cos(45°)
Suppose I want to inscribe a square inside a circle with a radius of 200. What will be the SVG coordinates of the four corners a, b, c, d? The center of the circle is at (0,0). Try to remember that the y-axis is "upside-down."
( ________ , _________ )
( ________ , _________ )
( ________ , _________ )
( ________ , _________ )
__________ Calculate 462 sin(90°)
__________ Calculate 462 cos(90°)
__________ Calculate 462 sin(45°)
__________ Calculate 462 cos(45°)
__________ Calculate 462 tan(45°)
__________ Calculate 462 sin(30°)
__________ Calculate 462 cos(30°)
__________ Calculate 462 tan(30°)
Calculate the six Scalable Vector Graphics (SVG) coordinates for a "north pointing" hexagon inscibed in a circle with a radius of 462 pixels. In the diagram the angle θ is 30°. The coordinates should be given in the SVG coordinate system.
Wave equation in terms of wavelength λ and distance x:
Wave equation in terms of period τ and time t:
Period τ and frequency f relationship:
A RipStik lays down a wave according to the equation:
a = _______________ Write the amplitude a of the equation.
λ = _______________ Write the wavelength λ of the equation.
A spring oscillates vertically according to the equation:
a = _______________ Write the amplitude a of the equation.
τ = _______________ Write the period τ of the equation.
f = _______________ Calculate the frequency f of the equation.
A RipStik was swizzled across a large sheet of paper. The swizzle wave can be seen in the diagram.
________ How many waves are shown in the diagram?
λ = _______________ Write the wavelength λ
a = _______________ Write the amplitude a.
τ = _______________ Write the period τ.
f = _______________ Calculate the frequency f.
y = ______ sin( _________ x). Write out the equation of the wave in terms of the wavelength λ and distance x.
Sketch a graph of the following function:
A RipStik lays down a wave according to the equation:
a = _______________ Write the amplitude a of the equation.
λ = _______________ Write the wavelength λ of the equation.
A spring oscillates vertically according to the equation:
a = _______________ Write the amplitude a of the equation.
τ = _______________ Write the period τ of the equation.
f = _______________ Calculate the frequency f of the equation.
A RipStik was swizzled across a large sheet of paper. The swizzle wave can be seen in the diagram.
________ How many waves are shown in the diagram?
λ = _______________ Write the wavelength λ
a = _______________ Write the amplitude a.
τ = _______________ Write the period τ.
f = _______________ Calculate the frequency f.
y = ______ sin( _________ x). Write out the equation of the wave in terms of the wavelength λ and distance x.
A Turkish F-4 Phantom II RC-4 is flying 23 kilometers off the coast of Syria. An anti-aircraft turret on the Syrian coast is tracking the Phantom.
Write the equation for the angle θ as a function of the distance x along the coast and the distance (23) of the Phantom from the shore. θ =
θ = _______ Calculate θ in degrees when x = 10.
Solve −4(cos x)2 −3 = 0 for x in degrees
Sketch a graph of the following function:
θ = __________ In the movie Pacific Rim the 260 foot tall Jaeger robot Gipsy Danger dragged a ship at an average angle θ
as seen in the diagram. Calculate the angle θ in degrees.
Malaysian Airlines flight 370 disappeared on a flight from Kuala Lumpur to Beijing. Boats working in the area where the plane was thought to have crashed detected what was initially thought to be electronic signals from the submerged aircraft. A diagram is seen below.
θ = _______ Use the information provided in the diagram to calculate the angle θ in degrees
φ = _______ Use the information provided in the diagram to calculate the angle φ in degrees
r = _______ Use the information provided in the diagram to calculate the length of the hypotenuse in kilometers
A RipStik was swizzled across a large sheet of paper. Use the wave and wave data provided to answer the following questions.
________ How many waves are shown?
λ = _______________ Write the wavelength λ
a = _______________ Write the amplitude a.
τ = _______________ Write the period τ.
f = _______________ Calculate the frequency f.
y = ______ sin( _________ x). Write out the equation of the wave in terms of the wavelength λ and distance x.
Use a spreadsheet to graph the data in the table.
x
y
0
0
1
14
2
20
3
14
4
0
5
-14
6
-20
7
-14
8
0
9
14
10
20
11
14
12
0
13
-14
14
-20
15
-14
16
0
17
14
18
20
19
14
20
0
________ How many waves are shown in the spreadsheet graph?
λ = _______________ Determine the wavelength λ
a = _______________ Determine the amplitude a.
y = ______ sin( _________ x). Write out the equation of the wave in terms of the wavelength λ
Solve 4 tan(x) −1 = 0 for x in degrees
Solve 4(cos x)2 −1 = 0 for x in degrees
Given the equation for velocity, the launch angle θ, and the distance:
for a launch velocity v = 15 m/s at θ = 72°
vx = ______________ Calculate the horizontal velocity vx
vy = ______________ Calculate the vertical velocity vy
d = _____________Calculate the distance d the object will travel.
For the vector =
260 i + 150 j
magnitude = __________ Calculate the magnitude.
θ = __________ Calculate the direction angle in degrees.
A vector with a magnitude of 100 is at a direction angle of 67° to the horizontal. Write the vector in i, j component form.
=
________ i + ________ j
Sketch a graph of the following function:
____________ The force vector for Jaeger Striker Eureka's right lead helicopter is given by = -120i + 140j. Calculate the angle to the vertical θ in degrees.
____________ Calculate the magnitude of the vector = -120i + 140j.
A force F of 5774 Newtons is being exerted at an angle of 30° to the horizontal on an object.
F ⋅ d ___________ Calculate the energy (work) done to move the object 10 meters using the dot product.
F ⨯ d ___________ Calculate the torque on the object if the lever arm distance is 0.3 meters using the cross product.
 Use a spreadsheet to make an xy scatter graph of the following baby growth data.
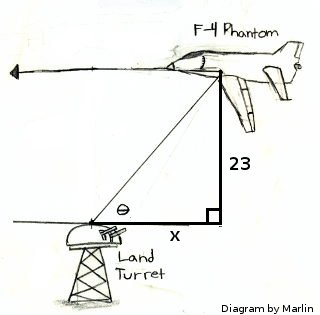 A Turkish F-4 Phantom II RC-4 is flying 23 kilometers off the coast of Syria. An anti-aircraft turret on the Syrian coast is tracking the Phantom.