
Genogram from Genopro, a non-free desktop based package.
This is a page of scratch work and notes related to the delivery of MS 101 Algebra and Trigonometry summer 2001, 2011, 2012, 2013, 2014, 2015, and 2017, at the College of Micronesia-FSM. These are essentially notes for the instructor, not necessarily for the students, hence the rambling, discombobulated, random nature of these notes. Links may be rotten, step with care.
Technical notes: these notes do not validate because the URLs that are produced by WolframAlpha contain bad values for attribute href on element a: Illegal character in query component. The bad values, or "unsafe" characters, are unsafe "because gateways and other transport agents are known to sometimes modify such characters. These characters are "{", "}", "|", "\", "^", "~", "[", "]", and "`"." (Berners-Lee, Masinter, McCahill: RFC1738). As these characters are a) fully functional for my non-transport/gateway use, b) an extra step inconvenient step to convert for notes being built in real time on the fly, and c) versions encoded with a URL encoder fail, I simply am not going to fix this issue.
Some of the notes refer to homework in Algebra and Trigonometry, 8th Edition, by Ron Larson.
The stucture of the course is to chase a particular model or system each day, and let the math flow from the demands of the model. Models come from a diverse array of fields including genealogy, physical science, health, and web page programming.
An introduction to exponents via ancestry and family trees
Genogram from Genopro, a non-free desktop based package.

The diagram above is called a genogram. If you want to make your own genogram, go to FamilySearch.org and start your family tree. You will have to activate an account using an email address. Otherwise you can do this exercise using "pencil and paper"
The course used to use Geni.com, but that site has become increasingly driven to find a way to monetize a relatively small user base. MyHeritage.com is a powerful on line package, but paywalls come quickly, all too quickly for students who can map their family trees out to third cousins and back for multiple generations. FamilySearch does have affiliations to a particular religious community and includes features unique to that faith, but provides the most capability of any free genealogy site. The site also taps into one of the largest genealogy databases on the planet.

If the chart extended to generation six, how many great-great-great-grandparents would you have?
Is there a function that can calculate the number of ancestors you have in any given generation?
Obtain historic population numbers
| State | Year | Population |
|---|---|---|
| Chuuk | 1925 | 10000 |
| Kosrae | 1880 | 274 |
| Pohnpei | 1920 | 5000 |
| Yap | 1920 | 8000 |
Suppose in every generation each pair of parents has only two children. For example, suppose you have only two children and they each have only two children who also each have only two children, and so forth...
Graphing the function y=2xabove using Desmos

Image source: XKCD
Brute force cracking of passwords depends on testing all possible letters, numbers, symbols, for all password lengths, something that is possible using modern graphics card engines.
So in blunting a brute force attack, what matters more, the use of additional symbols or longer passwords/passphrases? Caveat: no memorable string of characters or words will yield a secure password. Only truly random sequences of characters of great length is secure. This exercise is not exploring all means of cracking, only the implications of polynomial growth versus exponential growth in permutations.
What increases the number of permutations more rapidly: adding more characters or increasing the password length? To simplify, let's look at a password with a length of two in which the number of characters increase and then look at a password made of only two characters where the length increases.
Password length 2
Num
Chars	Permuations	Passwords
1	1		aa
2	4		aa ab ba bb
3	9		aa ab ac ba bb bc ca cb cc
4	16		aa ab ac ad ba ... cd da db dc dd
5	25		aa ab ac ad ae ... ea eb ec ed ee
6	36
Password characters 2
Length	Permuations	Passwords
1	2		a b
2	4		aa ab ba bb
3	8		aaa aab aba abb baa bab bba bbb
4	16		aaaa aaab aaba aabb abaa abab abba abbb baaa baab baba babb bbaa bbab bbba bbbb
5	32		aaaaab aaaba aaabb ....  bbbaa bbbab bbbba bbbbb
6	64
The governing function is:
(number of characters in character set)(length of password)
Increasing the characters means that the base changes for baseexponent. The variable is the base, or written algebraically, xconstant. For the example above, x2. This is a polynomial function.
Increasing the length means that the exponent changes for baseexponent. The variable is the exponent, or written algebraically, constantx. For the example above, 2x. This is an exponential function.
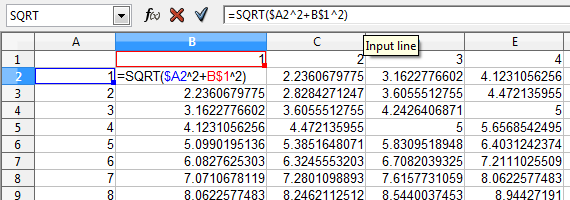
A spreadsheet can be used to graph the above functions. Set up the spreadsheet in the following pattern:
| A | B | C | |
|---|---|---|---|
| 1 | Number | Polynomial | Exponential |
| 2 | 0 | =A2^2 | =2^A2 |
| 3 | 1 | =A3^2 | =2^A3 |
| 4 | 2 | =A4^2 | =2^A4 |
| 5 | 3 | =A5^2 | =2^A5 |
plot y=2x using Desmos
To set a specific domain:
plot f(x)=2^x for x=0 to 5
To set a domain and add gridlines:
plot 2^x from x=0 to 5 with gridlines.
To plot multiple functions on one graph over a specific domain with gridlines. Note the necessary omission of f(x)= or y=. Plotting multifunctions fails if those are included.
plot (1/2)^x,2^x,3^x for x=-5 to 5 with gridlines
To obtain the same function with a visible legend for the three functions, omit the gridlines:
plot (1/2)^x,2^x,3^x for x=-5 to 5
Use fill down to extend the values and functions down the spreadsheet, graph the data using an xy scattergraph.
There is a good note on the focus of WolframAlpha on natural language processing and the logic to the limitations of WolframAlpha versus the full Mathematica platform. That said, many of the Mathematica functions also work in WolframAlpha. There is, however, no intent in the course to teach Mathematica commands.
Substitution and evaluation for a single value:
evaluate f(x)=0.9^x at x=1.4
ReplaceAll[0.9^x, x -> 1.4]
0.862858
(1/2)^x, x=2
Mathematica:{(1/2)^x, x == 2}
evaluate f(x)=2*e^(-5*x) at x=10 yields
ReplaceAll[2/E^(5 x), x -> 10]
2/e^50~~3.8575x10^-22
Thus the new skill to teach is where to put * and parentheses to faithfully reproduce the function in WolframAlpha. This is not trivial.
As of early May 2011, finding natural language inputs for evaluating a function across a domain of values has eluded me. In this case one has to either fall back on Mathematica functions or utilize a widget. There are many widgets already in existence that are custom designed to support a math instructor in the classroom, such as those by RWLMath
Generating a table of values for 0.5x from -6 to 6:
Table[0.5^x, {x, -6, 6}]. The format is Table[function, {variable, start, stop}]
To generate a table in specific steps:
Table[e^x, {x, -3, 4, 0.5}]
The HPE - Table of Values Calculator widget generates tables of values for a function. The author of that widget, RWLMath , has created a variety of widgets that appear to be directly useful in the classroom.
One can embed already developed widgets into a page or one can develop one's own widgets.
WolframAlpha's natural language is quite capable of parsing the complex evaluation:
Evaluate p*(1+(r/n))^(n*t) for p=1500,r=0.02,n=365,t=10
Note that the when typed into WolframAlpha, WolframAlpha will ask, "Wolfram|Alpha needs more time to respond to your query... Go on computing »". Click on Go on Computing to obtain the solution. Note that the above URL include the incParTime=True.
Mathematica: ReplaceAll[p (1 + r/n)^(n t), p -> 1500, r -> 0.02, n -> 365, t -> 10]
1832.09
WolframAlpha does NOT always follow the PEMDAS order of operations. (parentheses, exponents, multiplication, division, addition, and subtraction). For example, following strict PEMDAS rules, 81^1/4 should be equal to 20.25. Under PEMDAS, the exponent should be evaluated prior to the division. WolframAlpha, however, presumes that one meant 81^0.25 with a result of 3. WolframAlpha has implicitly added parentheses: 81^(1/4) To force the 20.25 result to appear, one has to enter (81^1)/4.
In other words, one should always use parentheses to ensure the WolframAlpha is interpreting an input as intended. One should not rely on PEMDAS.
My blog details the difference between the best fit functions generated by Microsoft Excel and LibreOffice.org Calc.
Facebook: spread of viral messages, spam. Growth rates at FB average of 130 friends. Growth rate at experimentally determined class average.
| Section | Edition | Pages | Problem set |
|---|---|---|---|
| 5.1 | 6 | 398-400 | 3, 5, 7-10, 19, 57 |
| 7 | 392-394 | 3, 5, 7-10, 11, 67 | |
| 8 | 388-390 | 9, 11, 13-16, 17, 73 |
Logarithmic fitting is easier from a spreadsheet than WolframAlpha. One of the intents of the course is to help students understand that different software tools have different strengths. Choosing the correct tool for the job is important.
Data table
| Age in months since conception | Actual mass |
|---|---|
| 9 | 3 |
| 9.5 | 3.4 |
| 11.5 | 5.2 |
| 13.3 | 6.1 |
| 14.2 | 6.4 |
| 15 | 6.6 |
| 17.5 | 7 |
| 21 | 9.1 |
| 25 | 8.2 |
| 26 | 8 |
| 27 | 8.8 |
| 37 | 10.5 |
| 57 | 13.2 |
The data is for my son. The dip at 26 and 27 months post-conception was a week long bout of diarrhea that required hospitalization. Note that "post-conception" is necessary because ln(0) is undefined. Mathematically the age of the baby cannot be zero. The choice of nine months is effectively abitrary.
WolframAlpha again behaves in a predictable manner with regard to natural language input:
Evaluate f(x)=log2(x) for x=32 yields x=32. Code for this:
Mathematica: ReplaceAll[Log[x]/Log[2], x -> 32]
Note the change of base structure in the Mathematica format. Again, there is no intent to teach the Mathematica form, although awareness of its existence is likely to be mentioned. The forms are useful as they can be reverse engineered if the need arose to handle a more complex situation.
log(x) is the natural log of x for WolframAlpha/Mathematica. The terms plot and graph are interchangeable.
log[b,z] is Mathematica format logarithm base b.
Graphing the natural logarithmic function:
Graph f(x)=ln(x)
Omitting the f(x)= or y= is useful as this permits extension to multiple plots on one chart.
graph x,e^x,log(x)
")
The above does is not aesthetically pleasing to a 20th century chalkboarder as the y = x reflection axis is not at a 45° angle. As of May 2011 attempts to either directly use a Mathematica command or a natural language input to control either the AspectRatio or the range have failed. WolframAlpha usually reverts to plotting only a single function when anything else is added to the multiple function list.
| Section | Edition | Pages | Problem set |
|---|---|---|---|
| 5.2 | 7 | 402 | 7, 19, 21, 27, 29 |
| 8 | 398 | 23, 25, 27, 33, 35 |
Change of base: log5(25)
Mathematica:Log[5, 25]
Result: 2
57.
expand log2(sqrt(a-1)/9) is interpreted correctly:
/9)")
Plaintext input equivalent:expand | log_2(sqrt(a-1)/9)
Note the underscore above after the log and before the 2.
Mathematica input: Expand[PowerExpand[Log[Sqrt[-1 + a]/9]/Log[2]]]
The underscore is optional, however WolframAlpha "suggests" the use of the underscore in the following example. The input was in Mathematica format, the plaintext equivalent includes the underscore character.

Another expansion
/9)") Plaintext output equivalent:
Plaintext output equivalent: (log(a-1))/(2 log(2))-(2 log(3))/(log(2))
Mathematica output: (-2 Log[3])/Log[2] + Log[-1 + a]/(2 Log[2])
5.3 #95 Galloping speed opendocument spreadsheet
Galloping speed WolframAlpha input.
Output: -20.8056 log(4.47779x10^-6 x)
Where x is the weight of the animal in pounds, y is the galloping strides per minute.
One can then expand that result to obtain:
256.25-20.8056 log(x)
Failed example:
Planetary distances from sun
Copy the plain text. Use paste special into LibreOffice.org and merge the space delimiters. Getting fancy: include the | delimiter. Select and sort on AU distance. Dead end. Leads to exponential. Can use log to linearize, but text fudges AU distances to improve fit. Plus the text book does not return to the logarithm as a mathematical explanation.
WolframAlpha will expand logarithms using the expand command, but will not "condense" (textbooks word) logarithms. Attempts to use simplify and combine also failed to produce the "condensed" result.
| Section | Edition | Pages | Problem set |
|---|---|---|---|
| 5.3 | 7 | 409 | 9, 11, 13, 15, 23, 25, 29, 85 |
| 8 | 405 | 15, 17, 19, 21, 29, 31, 35, 95 |
solve e^(-x^2)=e^(-3*x-4) for x
Yields both the wave results and the real results: a need to learn to read answers.
solve log_10(5x)+log_10(x-1)=2 for x
Provides only the x = 5 solution, not the spurious x = -4 that hand working generates. WolframAlpha reinforces the concept of the crossing of the graphs with a graphical solution presented as well. Getting these typed in correctly will clearly take time.
8th edition p417 #137. The automobiles problem, part a: One way to get answers for part a is by substituting the table values into the equation: -3+11.88ln(.2)+(36.94/.2).
There is, however, a way to have WolramAlpha fill out a table of evenly spaced values. The way is a little complicated and I do NOT expect you to use it. But you should know that a way exists to fill out a table in Wolfram Alpha. The following link will display the function and the result:
Table[-3+11.88ln(x)+(36.94/x), {x, 0.2, 1.0, 0.2}]
The format of that function is Table[function, {variable, startValue, endValue, increment}]
| Section | Edition | Pages | Problem set |
|---|---|---|---|
| 5.4 | 7 | 419 | 9 - 19 odd, 75 - 83 odd, 116 |
| 8 | 415 | 13-23 odd, 81 - 91, 136 |
Chose to focus on Usain Bolt's 2008 100m world record. At 8:00 in the morning there is still enough bandwidth to show an on line video - sort of. So I found and showed a video of Usain Bolts run, not a very good one, but just to give the class an idea of what happened.
Then I had the students enter Usain distance versus speed data into a spreadsheet and then try the four regression models in LibreOffice.org to find a fit.
| Distance (m) | Speed (m/s) |
|---|---|
| 0 | 0.0 |
| 10 | 5.4 |
| 20 | 9.8 |
| 30 | 11.0 |
| 40 | 11.5 |
| 50 | 11.8 |
| 60 | 12.2 |
| 70 | 12.2 |
| 80 | 12.2 |
| 90 | 12.1 |
| 10 | 11.1 |
None of the four models fits well, although the students favored the logarithmic fit. The logarithmic model may be a best fit, but the function cannot handle x = 0, starts too fast, and, possibly most problematic, the speed continues to rise without limit. Sprinters hit a maximum speed and then attempt to hold that speed into the finish line. The logarithmic model simply behaves incorrectly.
I then introduced a logistic model. plot -12.2+(24.4/(1+e^(-x/9))) from x=0 to 100. I first displayed the model using WolframAlpha to show the shape. Then I instructed the students how to enter the function into LibreOffice.org. Spreadsheets use the EXP() function for the base e. The EXP function does not use a exponentiation symbol, so there is no "^". Spreadsheets also do not use the variable x, a cell address must be used instead. If the Distance data is in column A, then the function in cell C2 would be =-12.2+(24.4/(1+EXP(-A2/9))).
I wrapped with some homework including Usain's speed at 15 meters and the distance at which Usain reaches my running speed, 2.5 m/s.
The pedagogical intent was again a focus on the 60% of the class that are elementary education majors. While a first grade teacher may never again see a logistic function, they will see a spreadsheet and likely use one at some point. Familiarity with spreadsheets and entering functions into spreadsheets is a career-useful skill for an educator. Learning to team up tools such as WolframAlpha and a spreadsheet, using each where it is strongest, is useful.
Note too I neglected the other models, in part because I have been focusing on models from day one. The one model I neglected, the Guassian curve, is the statistics normal curve. Yet even in statistics that curve is never tackled algebraically.
FWIW, WolframAlpha will plot the Usain data:
ListPlot[{{0,0},{10,5.39},{20,9.806},{30,11},{40,11.5},{50,11.8},{60,12.19},{70,12.19},{80,12.19},{90,12.06},{100,11.1}}]
.
To date, however, I cannot get WolframAlpha to plot the data and the function together on one plot.
Data from the banana leaf marble ramp exercise was used on test two.
| Height h (cm) | Velocity v (cm/s) |
|---|---|
| 0 | 0 |
| 10 | 97 |
| 20 | 142 |
| 30 | 182 |
| 40 | 208 |
Despite playing with options, I could not find a way to have WolframAlpha run a power regression on the
data
. A power regression fits better than a logarithmic. As noted above, finding a way of getting points and functions plotted together in WolframAlpha has eluded me. The students used LibreOffice.org Calc to plot the data and find the best fitting regression function.

| Section | Edition | Pages | Problem set |
|---|---|---|---|
| 5.5 | 7 | 430 | 1 - 6, 63, 66 |
| 8 | 426 | 7 - 12, 75, 78 |
Concept is to hope for sun and run three radii of yarn out. Get angle in degrees. Use surveyor's wheel to measure actual arc length. Calculate radian measure.
Summer 2012 measured a 180° arc on the lawn with a radius of 1145 cm. Surveyor's wheel arc was 3627 cm (119 feet). Surveyor's wheel kept tending to go straight along a chord of the circle, slacking the radial line. Angle is pi, 3.16 by the above numbers.
Summer 2013 rain forestalled going outdoors. I borrowed a wheel used to demonstrate the gyroscopic effect. The wheel had a radius of 25.5 centimeters. I cut poster paper in half the long way, taped the narrower ends together, and placed the paper on two folding tables placed end to end. I put four evently spaced post-it notes on the wheel rim. Using a cloth tape measure, I determined the wheel to have a circumference of 160.2 cm, which I rounded to 160 cm. I rolled the wheel and marked the post-it note locations. The post-it note marks were not at exactly 40 cm, so I used the 160/4 = 40 cm to calcuate the angles. 40/25.5 = 1.57. 80/25.5 = 3.14. 120/25.5 = 4.71. 160/25.5 = 6.27.
I noted that these number had no units. When dividing 160 cm ÷ 25.5 cm, the centimeters cancels. These angles have no measure, no units. Only later did I introduce the term radians.
Then I introduced the degree based system. There are discussions of why the degree system uses 360 degrees in a circle in the Wikipedia and in the Math Forum.
I should have, but did not get time to, put up a unit circle with both radians and degrees.
Summer 2015 a 44 foot length of heavy clothes line and a surveyors wheel was used to measures distances around a circle. was at 68 feet of arclength. π at 145 feet of arclength. at 216 feet. 2π at 295 feet. π a tad high at 3.35
Vertex, angles, acute 30°, 45°, 60°, right 90°, complementary, obtuse, straight 180°, supplementary. θ.
s= rθ.
Rotational velocity ω
Character map (charmap.exe) can be used to obtain a degree symbol. WolframAlpha also has an on-screen keyboard that includes four symbols, among them degrees. convert 30° to radians
Alternatively one can type the word degrees. convert 30 degrees to radians. Note that for both of the above, WolframAlpha will provide an "instant answer" via JavaScript.
I found that WolframAlpha could solve the arclength problems with an angle input as degrees if set up as:
solve for s: s=14*(45 degrees)
This input is faulty as the angle should be in radians, but WolframAlpha obliges, dumps out two options for the answer, the second of which is the desired answer:
s = 630 ° ~~ 10.9956
| Section | Edition | Pages | Problem set |
|---|---|---|---|
| 6.1 | 8 | 452 | 11, 13, 23a, 23b, 63, 65, 67, 69, 71, 73, 79, 81, 83, 85, 87, 91, 92, 95, 96 |
Note: The above homework is easier and faster with a calculator and the relationships pi radians = 180° and s= rθ
Over the next couples of days the models focus on web page creation using Scalable Vector Graphic (SVG) extensions to HTML5. This is the cutting and bleeding edge of web page design. You will be using trigonometry to lay out some basic shapes on a 200 by 200 grid with these technologies. These skills, based in mathematics, are of most use to the CIS majors. The activities also provide a vehicle for exploring the trigonometric functions.
SVG graphics load with the web page because they are simply HTML text based code. This results in fast load times. The graphics are also easy to reuse, modify, and redeploy because they are simply text. SVG graphics also rescale without "jaggies" developing. The following is an example of an SVG graphic.
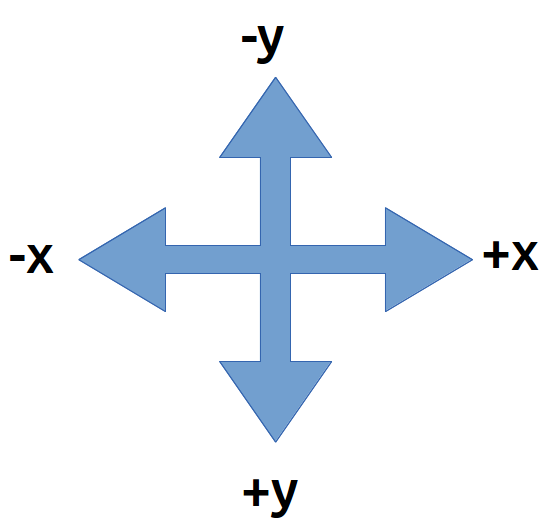
Note that a transform="translate(100,100)" statement is used in the SVG to move the origin from the upper left corner to the center.
The SVG grid is like an xy graph EXCEPT that the y-axis is UPSIDE-DOWN. To draw shapes on the grid you will use a text editor. This will be demonstrated in class. Then the pages will be opened and viewed using FireFox. As of 2013 Google Chrome can also render SVG, but not MathMl. These notes are composed in HTML5 using both SVG and MathMl.
HTML5 + SVG code is composed using a text editor.


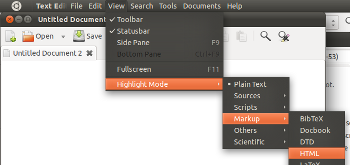
Click on the text editor. To help check for errors, set the highlighting mode to HTML.
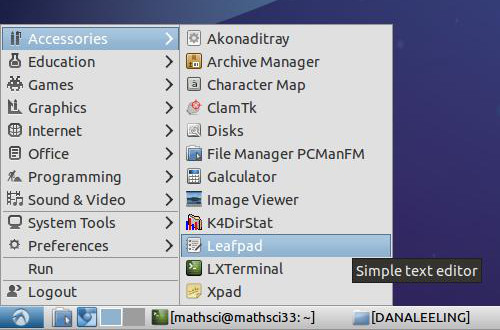
In Lubuntu, use LeafPad on the Accessories menu
For more capabilities, download and use SciTE. SciTE is in the Lubuntu repositories.
In Microsoft Windows use Notepad.exe as a text editor.

Launch this from the "Run" dialog box in the start menu.
For serious programming efforts, consider downloading and using the free editor Notepad++. Notepad++ has SciTE/Scintilla as the core editor and adds plug-in and other support.
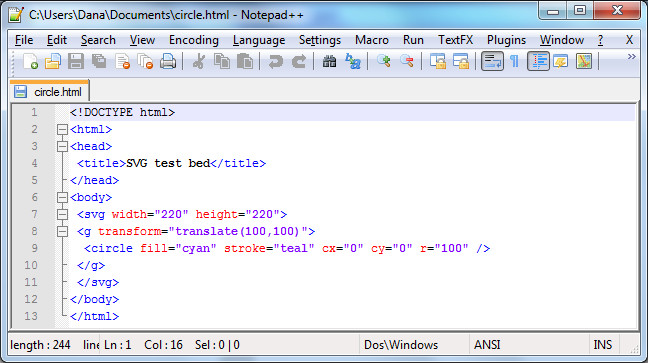
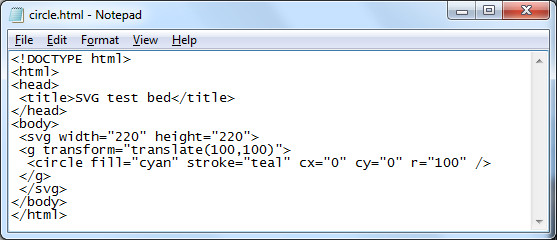
The following HTML code will draw a circle with a radius of 100 pixels on a web page.
<!DOCTYPE html>
<html>
<head>
 <title>SVG test bed</title>
</head>
<body>
 <svg width="220" height="220">
 <g transform="translate(100,100)">
  <circle fill="cyan" stroke="teal" cx="0" cy="0" r="100" />
 </g>
 </svg>
</body>
</html>
HTML is very very fussy - the slightest typing error will cause the web page to fail. The center of the circle is at (cx,cy). The numbers are measurements in pixels. Pixels are "picture elements". Picture elements are the smallest controllable element of a computer monitor.
The next task is where trigonometry comes into play: we are going to draw a square in the circle. To draw the square exactly inside the circle ("inscribed") we need to determine where the corners of the circle are located. The circle has a radius r of 100.
To draw a square in a circle we will need to locate the corners of the square. To do this we will need to work out the length of the adjacent and opposite sides of a 45° triangle. This will help us locate the corners of the 45-45-90 right triangle that is the building block of the square.
The SVG code to draw this square will have the form of...
<path fill="none" stroke="silver" d="M x1,y1 L x2,y1 x2,y2 x1,y2 x1,y1" />
where the x1,y1 elements will be replaced by numbers, by coordinate pairs.
Calculating the coordinates requires determining the length of the bases of the 45-45-90 triangle. This calculation requires using sine and cosine. The sine function, abbreviated sin, can be used to calculate the length of the side opposite the angle theta θ.
Cross multiply and one gets y = r sin(θ).
r = 100 and θ = 45°
Thus y = 100*sin(45°)
To calculate this use WolframAlpha:
100*sin(45 degrees)
The cosine function, abbreviated cos, can be used to calculate the length of the side adjacent the angle theta θ.
Cross multiply and one gets y = r cos(θ). r = 100 and θ = 45° Thus y = 100*cos(45°) To calculate this use WolframAlpha: 100*cos(45 degrees)
For both of the above results, we will have to round off the decimal portion of the number. SVG does not use fractional pixel values. Both calculations have the same answer: 71 pixels.
The center of the circle is (0,0). This is our "starting" place. Moving to the right 71 pixels adds 71 to x-value in the (x, y) coordinate. This puts us at the right-angle corner of the triangle.
Moving up 71 pixels is moving in the negative y direction. This means we have to subtract 71 from the y value at the right-angle corner.
Thus the coordinate for the upper right hand corner is (71,-71). This will be the first coordinate in the path command that will draw our square
<path fill="none" stroke="black" d="M 71,-71 L , , , , " />
The "M" in the path attribute means "Move to..." This tells the computer where to start our SVG diagram. The "L" means "Line" as in "draw a Line to". The next step is to tell the computer where the line should go.
Let us start by going down to the lower right corner of the square. Using the same basic argument as above, the lower right corner of the square must be 100*sin(45 degrees) below the center - that is, 71 pixels down from 0. Or 142 pixels down from the upper right corner. Each side of the square is two times 71 pixels long.
<path fill="none" stroke="black" d="M 71,-71 L 71,71 , , , " />
Using the above approach, we can work our way around the square, corner to corner, returning eventually to the upper right corner at (71,-71).
<path fill="none" stroke="black" d="M 71,-71 L 71,71 -71,71 -71,-71 71,-71" />
Square, re-centered on (0,0)
<!DOCTYPE html>
<html>
<head>
 <title>SVG test bed</title>
</head>
<body>
 <svg width="220" height="220">
 <g transform="translate(100,100)">
  <circle fill="lavender" stroke="indigo" cx="0" cy="0" r="100" />
  <path fill="thistle" stroke="black" d="M 71,-71 L 71,71 -71,71 -71,-71 71,-71" />
  </g>
 </svg>
</body>
</html>
The colors used in the above HTML/SVG code come from the X11 color palette.
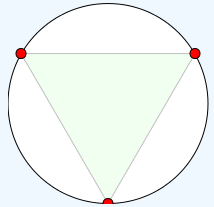
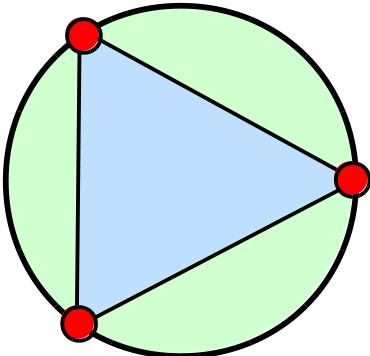
Summer 2013 I began with a heaxagon inscribed in a circle and then drew in the equilateral triangle with one vertex due west. I used a circle center of (0,0) and a radius of 100 after showing that a radius of one pixel was too small to be usefully seen. I used a (0,0) center and added a transform="translate(100,100) to move the diagram to the correct center. This increased the "symmetry" of the path points. The complication is that introduces negative coordinate values. Negative numbers can lead to sign errors, so I do not know if the simplification of the coordinates via symmetry will be offet by the complication of negative coordinate values. The new (0,0) center led to considerable symmetry in coordinate values. The notes were post hoc updated in 2013 to begin from a transformed (translated) coordinate system. In 2014 and 2015 the transformed coordinate system was used. There are both gains in symmetry and a natural logic to the circle being centered at (0, 0). The original untranslated coordinate system has not been used since 2012.
Next we will tackle an equilaterial triangle. The key to solving this will be using the 30-60-90 triangle in the diagram below.
Summer 2012 layout on the left. Summer 2013 layout as of the end of Monday 24 June on the right. Summer 2013 the center was set at (0,0). On Tuesday I will introduce the transform attribute on a graphics element g to move the triangle: <g transform="translate(100,100)"> and </g> The notes below are not yet edited to reflect this shift. Homework is to find the coordinates of the red circles based on the center being at (0,0)
Homework: Using adjacent = r cos θ and opposite = r sin θ, try to work out the coordinates of the circle at the vertices of the equilateral triangle. Note that r = 100, the center of the triangle is located at (0, 0), and the angle θ is 60°. The grid we are using is on the right.
The angle θ is 60°. Your text book notes that a 30-60-90 triangle is another "special" triangle. They are special because they build equilaterial triangles and hexagons, among other reasons.
The hypotenuse r is 100 pixels long. The angle θ is 60°.
The adjacent side uses the cosine function:
adjacent = r cos(θ). r = 100 and θ = 60° Thus adjacent = 100*cos(60°) To calculate this use WolframAlpha: 100*cos(60 degrees)
The opposite side still uses the sine function:
opposite = r sin(θ). r = 100 and θ = 60° Thus opposite = 100*sin(60°) To calculate this use a calculator or WolframAlpha: 100*sin(60 degrees)
The adjacent side is 50 pixels. This can be added to the appropriate value at the origin. Think of moving 50 along the adjacent side.
Rounded off to the nearest whole number, the opposite side is 87 pixels. This tells us to go 87 from where we ended up after moving 50 along the adjacent side.
Whether the 50 is added to the x or y value of the center depends on the orientation of the triangle. The summer 2012 "point north" triangle has the 50 added to the y-value. The summer 2013 "point west" triangle adds the 50 to the x-value of the center. Work out the appropriate values and additions/subtractions from the diagram.
As you "work" your way around a diagram always remember:
Summer 2012 path element code: <path fill="none" stroke="black" d="M 100,0 L 187,150 13,150 100,00" />
Homework summer 2012: Draw an equilateral triangle with one vertex at the bottom of the square.
Homework summer 2013: Draw an equilateral triangle with one vertex pointing east.
The relationship between x, y and the angle theta θ is given by a third trigonometric function, the tangent function. The tangent is also the slope of a line if the adjacent side is horizontal.
| Section | Edition | Pages | Problem set |
|---|---|---|---|
| 6.3 | 7 | 479 | 1ab, 65, 67, 69 |
| 8 | 475 | 5ab, 71, 73, 75, 107, 109 |
The following will display in FireFox 6.0a1 (Mozilla/5.0 (Windows NT 6.1; Win64; x64; rv:6.0a1) Gecko/20110523 Firefox/6.0a1). The html will not pass validation - no doctype is the primary error.
<html>
<head>
 <title>SVG test bed</title>
</head>
<body>
 <svg fill="turquoise" stroke="teal" >
  <circle cx="20" cy="20" r="10" />
 </svg>
</body>
</html>
But oddly enough the following actually validates!
<!DOCTYPE html>
<html>
<head>
 <title>SVG test bed</title>
</head>
<body>
 <svg fill="turquoise" stroke="teal" >
  <circle cx="20" cy="20" r="10" />
 </svg>
</body>
</html>
The above, however, is limited in FireFox to some sort of default vertical height of 150. SVG elements must explicitly close or subsequent elements fail.
6.3 was integrated into the above SVG material.
I used my RipStik to introduce section 6.4. Getting a good sine wave requires traveling in a perfectly straight line at a constant swizzle rate and a constant linear speed. I used too short a run in and was not set up and moving stably as I crossed the paper. The next day in physical science class I happened to be running the same exercise for section 091. I found that if I used over half the porch to set up my swizzle and my speed, I could run a very straight line with a clean swizzle. I used all of the length of the A201 and A202 classrooms, crossing the paper midroom A203.
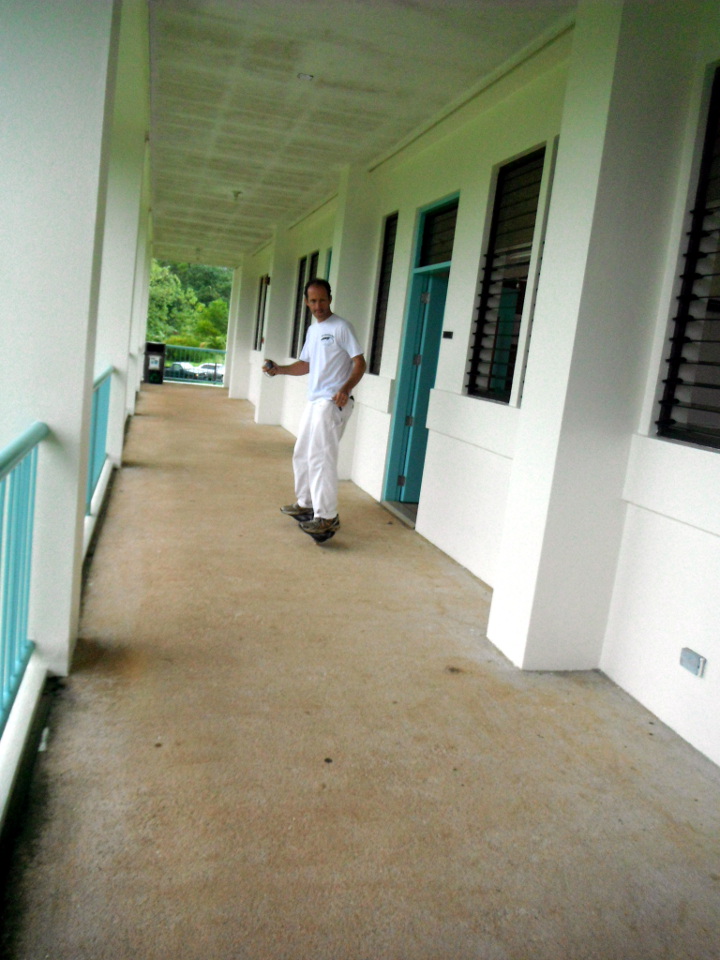
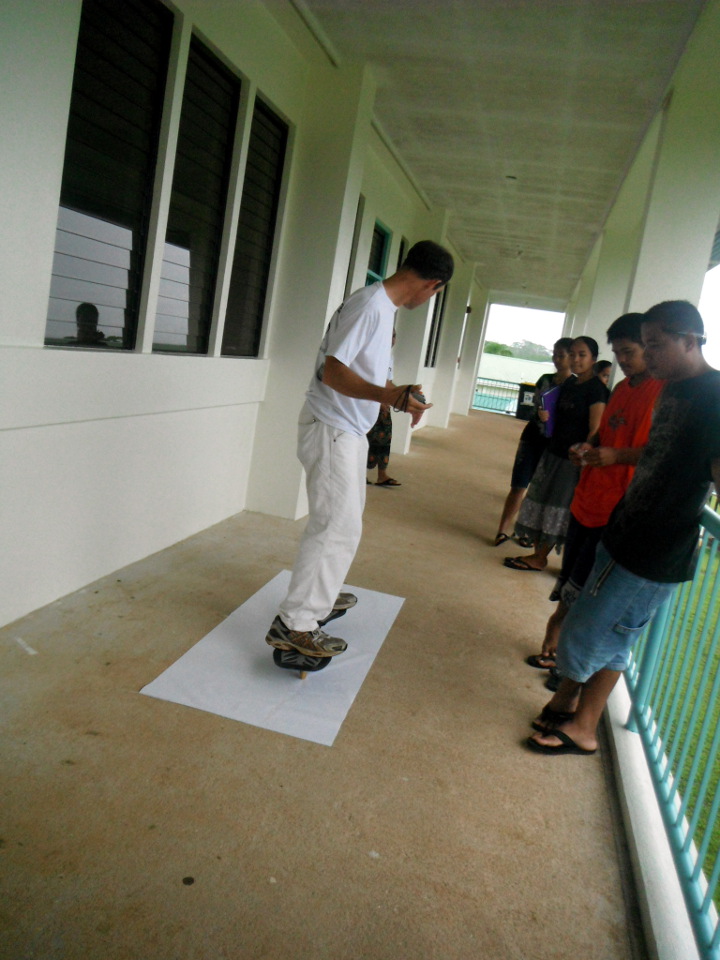
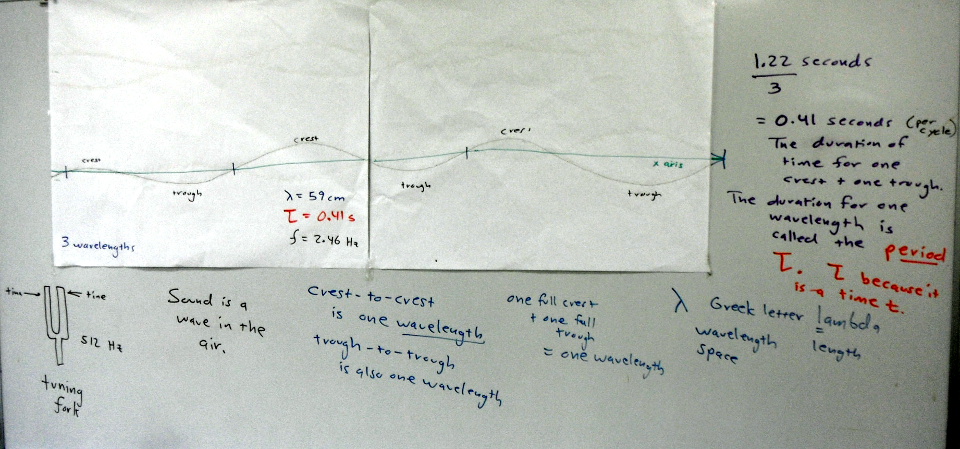
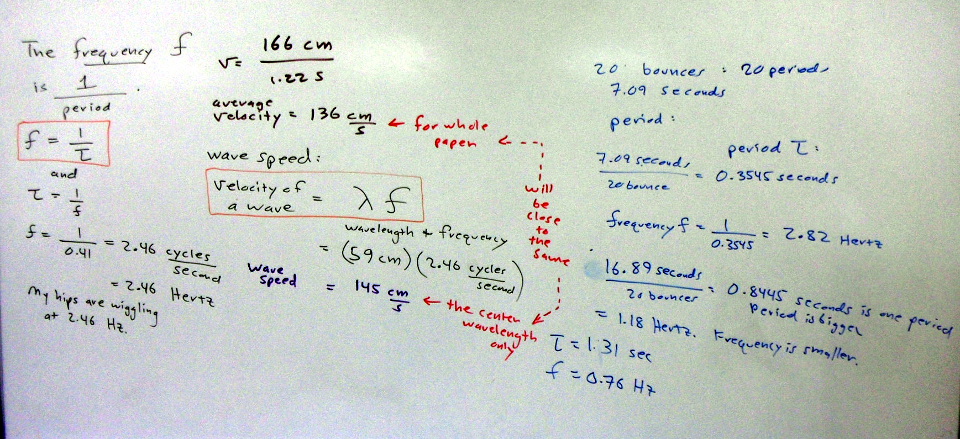
Introducing Sine Waves in Trigonometry with a RipStik Using this approach I also introduced the wavelength - something the text omits in favor of focusing on the period. I also introduced frequency, something the text leaves for a homework problem (77 in the seventh, 91 in the eighth). I brought in a tuning fork and showed the class that Larson has the problem the wrong-end around: tuning forks always have their frequency stamped on the them, not their period. One can then work out the period from the frequency.
I also worked the wavelength from the relation wave velocity = frequency * wavelength and the speed of sound (http://www.wolframalpha.com/input/?i=sound+speed+32+Celsius+74%25+relative+humidity yields about 350 m/s. Data is from my physical science class.)
plot 4 sin(2*pi*x/32) from 0 to 64
| Section | Edition | Pages | Problem set |
|---|---|---|---|
| 6.4 | 7 | 490 | 1, 2, 3, 23, 24, 57, 77 |
| 8 | 486 | 5, 7, 9, 27, 28, 67, 91 |
In 6.5 I had the students using WolframAlpha to produce graphs, and I connected tangent to the slope of a line when the angle theta is in the "standard" position.
The tangent of an angle is the slope of the reference angle. As the angle moves from 0 to pi/4, the slope runs from zero to one. From pi/4 to pi/2 the slope increases from one to undefined. The tangent function graph reflects this and has asymptotes at multiples of n*pi+ pi/2. I drew triangles on the board from 0° through 30°, 45°, 60°, to "89"° and calculated the tangent of theta from opposite over adjacent based on a hypotenuse of unitary length. Then the tangent function was graphed.
Damped sign waves, an earlier homework problem in the text, are introduced here as well.
In class I ran an example of an observer with a camera located 5 km from a rocket launch. The rocket launch is vertical. What is the height h as a function of the camera tilt angle θ?
Start with SOH-CAH-TOA and look for the relation where you have two pieces of relevant information. Adjacent is 5 km and opposite is h: you have OA, so you need TOA. tan θ = h/5 so h = 5 tan θ.
| Section | Edition | Pages | Problem set |
|---|---|---|---|
| 6.5 | 7 | 502 | 75, 76, 88 a) y2 only |
| 8 | 499 | 91, 92, 106a) y2 only |
The sine function does not pass the horizontal line test, thus constructing a inverse function is problematic. However, by restricting the domain to -90° ≤ x ≤ 90°, then an inverse function can be defined. The inverse function of the sine calculates the angle θ from the value of the opposite divided by the hypotenuse.
Given an angle in a triangle with a hypotenuse of 5 and an opposite side of 3, what is the angle θ? Solution: arcsin(3/5)
WolframAlpha accepts either arcsin() or sin^-1() as input notation. The textbook uses the latter notation. The negative one is not an exponent, which makes this notation particularly confusing. The arcsin notation at least makes sense: The arc (angle) whose sine is 3 ÷ 5.
Build the task of finding the arc functions on top of finding the angles for Pythagorean triples. I asked the class if they knew of whole numbers which satisfied a² + b² = c². I also noted that equation can also be written as x² + y² = r² or adj² + opp² = hyp². One student eventually answered 3-4-5. After showing this worked, I showed that 3-4-5 is the first triple in a family of similar triangles that form triples.
Use the triples in the search for the angles for those triangles
I then noted that the next step was one that was focused on the CIS majors: using a mixed address formula in a spreadsheet to generate a map of Pythagorean triples. For a list sorted by angles closest to 45° see pythagorean triples list.
Homework did not make sense summer 2014. Chose new set from text
| Section | Edition | Pages | Problem set |
|---|---|---|---|
| 6.6 | 7 | 511 | 1, 5, 37, 39, 91, 92 |
| 8 | 507 | 5, 9, 43, 45, 105, 106 |
Plus the angles θ and φ for the following triangle:
and find the length of the hypotenuse and the angles θ and φ for:
Taking a cue from the text, I focused on harmonic motion. I brought in a spring and masses, timed the period, and presented the physics forms of the equations. I noted that Larson seemed bent and determined on confusing the students by using omega in chapter 6.7 while in an earlier chapter Larson had used b. And in neither instance did he start with nor explicity state the physically meaningful versions of the sine functions with the period, frequency, or wavelength specifically stated. So I put masses on the spring and used a stopwatch to time the period. After a demo at 500 grams, I had the students try one at 700 grams. The bounce rate of the spring, by the way, varies with the mass.
| Section | Edition | Pages | Problem set |
|---|---|---|---|
| 6.7 | 7 | 524 | 52, 59, 60, 61, 66 |
| 8 | 520 | 54, 61, 62, 63 |
ln|cos x|-ln|sin x|
ln|cot (theta)| + ln|1+tan^2(theta)|
solve for mu: mu*W*cos(theta)=W*sin(theta)
| Section | Edition | Pages | Problem set |
|---|---|---|---|
| 7.1 | 7 | ||
| 8 |
tan t cot t=1
tan^2(theta)/sec(theta)=sin(theta)*tan(theta)
(1+cot^2(x))*(cos^2(x))=cot^2(x)
tan^4(x)+tan^2(x)-3=sec^2(x)*(4*tan^2(x)-3)
The gnomon problem reveals most clearly that Larson does not come at true physical problems from a physical perspective. One would never ever wind up with:
h sin(pi/2-theta)/sin(theta)
as a starting point. One would most like soh cah toa and then use tan(theta)=opposite h/adjacent s.
Solving for s yields s = h/tan(theta) or s=cot(theta) - the solution to the homework problem above (8th edition #70 p546).
solve 1/12*(cos(8*t)-3*sin(8*t))=0 for 0<t<1 is the only form that generates decimal equivalents.
Using domain limits is tricky business at best. WolframAlpha sometimes balks. And WA seems to prefer < to <=.
WolframAlpha by default quotes angular solutions and being within the range negative pi radians to pi radians. The text quotes solutions in quadrant III and IV as being angular measures between positive pi and positive two pi. I was able to force solutions to land between 0 and two pi in the following instance:
solve Cos[2 x] - Cos[x] = 0 for -1 < x < 7.
This was based on the following Mathematica construct:
Reduce[{(Cos[2 x] - Cos[x]) == 0, 0 < x < 7}, x]
Note the intentional omission of the N[Reduce which generates the two pi n repeat cycle.
WolframAlpha behaves very differently depending on what one enters. Run the following sequence:
4 sin(x) cos(x)=1
yields a series of unworked out decimal solutions with an n-repeat.
4 sin(x) cos(x)=1 for 0<x<7
yields a graph only, no solutions.
solve 4 sin(x) cos(x)=1 for 0<x<7
yields worked out decimal solutions between 0 and two pi.
| Section | Edition | Pages | Problem set |
|---|---|---|---|
| 7.3 | 7 | 558 | 7, 9, 11, 12, 29, 69, 70 |
| 8 | 554 | 11, 13, 15, 16, 33, 89, 90 |
Using a radar gun, I timed a foursquare kickball in flight on low and high arcs. I neglected to attempt to measure the angle of launch, that would be a good addition. I then derived the equation for a projectile launched from y = 0. Homework was built around the equation. After HW review of 7.3, this takes the rest of the period.
Summer 2015 I started class on the sidewalk with a RipStik exercise, using the radar gun to obtain the perpendicular launch velocity of the ball. Details blogged.
vector {80, 80}
vector {-86.16, 50}
vector {-40,-30}
vector {95,0}
Apparently regular parentheses also work. Introduced i, j notation, connection to xy plane. Magnitude is radius is hypotenuse. Angle is arctan(j coefficient/i coefficient).
| Section | Edition | Pages | Problem set |
|---|---|---|---|
| 8.3a | 7 | 619 | 55, 56 |
| 8 | 615 | 63, 64 |
Scalar multiplication: multiplying the magnitude.
Vector addition: adding vectors. Easiest in i, j form: add the components. If given magnitude and direction angle θ, use r sin θ and r cos θ to find the i, j components. Why vectors add... throwing a ball from a RipStik. Sailing a sail boat. Piloting a ship in a current. Flying a plane in winds aloft. Forces acting on objects. Tension in support lines and guy wires.
| Section | Edition | Pages | Problem set |
|---|---|---|---|
| 8.3b | 7 | 619 | 43, 44, 53, 54, 73, 78 |
| 8 | 615 | 53, 54, 65, 66, 83, 85 |
After a very brief introduction of magnitude and direction angle, I moved on day two into dot and cross products. Using the physics definitions of the dot product being F d cos(θ) and the cross product being F d sin(θ) where F is the force, d is either the distance the object moves or the lever arm length, and θ is the angle between the two vectors. I used the toy pull cart wagon in my office to illustrate the effect of pulling the cart versus applying a torque and thus lifting the front wheels of the toy wagon up.
I wanted the students to see some mathematical operators beyond what they had seen thus far in life, to lift them higher up on the mountain of functions.
This also allowed me to introduce a reason why I use asterisk for multiplication, besides its default use spreadsheets, programming languages, and WolframAlpha this way. I save dots and crosses for dot and cross products. Larson covers dot products but in a horribly obtuse and obscure fashion with the throttle set to full theoretic. Then, as always, "real world" problems are glued on during the homework.
For the problems below, calculate the work done using the dot product, calculate the torque using the cross product.
| Section | Edition | Pages | Problem set |
|---|---|---|---|
| 8.4 | 7 | 631 | 71, 72, 73, 74 |
| 8 | 627 | 79, 80, 81, 82 |
Three equations in two unknowns...
solve x^2+y^2=144,(x-3)^2+(y-3)^2=144,y=-x+3
Note that the red solution marking spots, which can be hovered to reveal the decimal answer, have disappeared. The answer is still quoted.
| Section | Edition | Pages | Problem set |
|---|---|---|---|
| 9.1 | 7 | 666 | 49, 52, 53, 55, 70* |
| 8 | 662 | 55, 56, 57, 59, 74* |
*See the note on plotting multiple functions and the need to omit the dependent variable.
A sphere at the origin, radius 5: Sphere[{0, 0, 0}, 5]
Sphere, defined mathematically: Sphere
Sphere, defined mathematically: Sphere
Cylinder, defined mathematically: cylinder
Platonic solids: Platonic solids
Archimedean solids: Archimedean solids