Functions and composition of functions to create a simple graph plotter with OpenOffice Calc and SVG
Compositions are useful for converting between coordinate systems. Remember the Scalable Vector Graphics (SVG) coordinate system we met on the first two days of class? The Scalable Vector Graphics y coordinate was "upside down" compared to the "algebra" y coordinate system. HIGHER SVG y-values were LOWER on the screen.
Compositions can correct for this, converting from algebra coordinates to SVG coordinates. Using functions and compositions of functions we can use a spreadsheet to calculate SVG coordinates to use in a simple SVG graph.
In the following exercise three functions are used:
f(x) = 2x − 3 (This is the first line we are graphing)
g(x) = 20x + 200 (This converts the algebra x coordinate to the SVG x coordinate).
h(x) = 200 − 20x (This converts the algebra f(x) to an SVG y coordinate. The negative slope handles the "upside down" SVG y coordinates. )
1. Open the OpenOffice.org Calc spreadsheet.
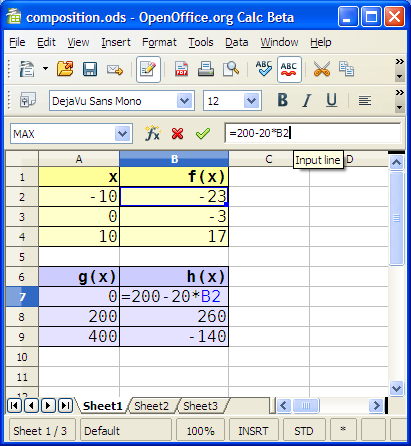
2. Enter the following data and formulas:
|
|
A |
B |
|
1 |
x |
f(x) |
|
2 |
-10 |
=2*A2-3 |
|
3 |
0 |
=2*A3-3 |
|
4 |
10 |
=2*A4-3 |
|
5 |
|
|
|
6 |
g(x) |
h(x) |
|
7 |
=20*A2+200 |
=200-20*B2 |
|
8 |
=20*A3+200 |
=200-20*B3 |
|
9 |
=20*A4+200 |
=200-20*B4 |
|
g(x) |
h(x) |
|
0 |
660 |
|
200 |
260 |
|
400 |
-140 |
The values g(x) and h(x) form a coordinate pair in SVG space.
If you typed the formulas correctly you should get the results seen on the right in the lower table above.
g(x) and h(x) are coordinate pairs in "SVG space." Written in coordinate pair notation, the coordinates are:
(0, 660) (200,260) (400, −140)
We can draw a line through these coordinates by using the SVG command:
<path d="M 0,660 L 200,260 400,-140" />
That command says: Move to 0,600 draw a Line to 200,260 and then to 400,−140. The Move to does not draw any line. The Line command can take any number of coordinates and will keep drawing from each to each next coordinate.
The algebra coordinate for x = 0 is (0, −3). In SVG coordinate space this "composes to" (200,260). We can put a circle there with the following command:
<circle cx="200" cy="260" r="5" />
That command puts a circle with a center at (200, 260). cx is center x coordinate, cy is center y coordinate. r is the radius of the circle.
We will need to add commands for line color, line width, and the fill color for the circle. The finished SVG is at:
http://www.comfsm.fm/~dleeling/math/m82/simplegraph.svg
3. Open the SVG file specified above. Choose the View menu and select Page Source to see the complete code. Copy and paste this code to the gEdit Text editor on the Ubuntu Accessories menu.
4 . To graph a different f(x) algebra function, different from f(x) = 2x − 3, we only need to change the function f(x) in B2, B3, and B4 in the spreadsheet. Everything else can stay the same. The g(x) and h(x) table will provide the coordinates for the new line. Then we can enter the new coordinates into the path command using gEdit, save the file, and display the new line using the browser. Remember to also change the coordinates of the y-intercept circle to the new y-intercept coordinates.
The mathematics of functions underneath this exercise:
f(x), g(x), and h(x) are linear, first degree functions. h(x) has as its input f(x). In math notation: h(f(x)) or more accurately: (h ∘f)(x). The SVG y coordinate is a result of the composition of the h(x) and f(x) functions. The original x-value is first evaluated by f(x) and then that result is evaluated by h(x). In the example on the right, −10 goes into the f(x) machine as f(−10). The result is −23 which is then put into the h(x) machine as h(−23). The final result is the SVG screen coordinate of 660.
Try to graph the following functions:
1. f(x) = x + 4
2. fx) = −x + 3
3. f(x) =
![]()
4. f(x) = −0.25x + 4
Underneath the path command for the line of the function try adding the command:
<path stroke="red" d="M 50,0 Q 200,600 350,0" />
That is a capital Q , not an L in the middle of that command. If you succeed, what shape did you get on your graph?
Actual SVG code used in the simple graph SVG:
<?xmlversion="1.0" encoding="utf-8"?>
<svg xmlns="http://www.w3.org/2000/svg" width="400px" height="400px">
<title>Simple Graph</title>
<g stroke="black" stroke-width="2px" fill="none">
<rect x="0" y="0" width="400" height="400" />
</g>
<g stroke="green" stroke-width="2px" fill="green">
<desc>Axes</desc>
<path d="M 200,0 L 200,400 M 0,200 L 400,200" />
</g>
<g stroke="blue" stroke-width="2px" fill="none">
<desc>Function line</desc>
<path d="M 0,660 L 200,260 400,-140" />
  </g>
<g fill="deepskyblue" stroke="black" stroke-width="2px">
<desc>y-intercept</desc>
<circle cx="200" cy="260" r="5"/>
</g>
</svg>