Dolphin 052
Developed by Dana Lee Ling with the support and funding of a U.S. Department of Education Title III grant and the support of the College of Micronesia–FSM.
A thumbnail sketch is a small sketch about the size of a matchbook.
The ^ character is made by typing shift-6
The minus key is in the upper right hand corner of the keyboard
Subscriptsthis is a subscript are made by typing shift-minus
Open MathView
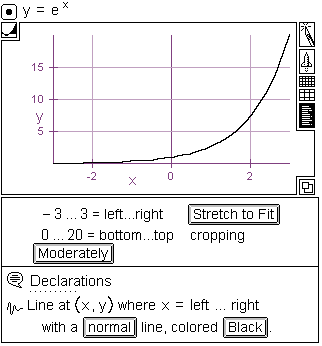
Graph y=ex by:
Type: y = e ^ x
Click on the equals sign
Choose the Graph menu
Choose y = f(x) on the Graph menu
Choose Linear on the submenu of y = f(x)
The result should be similar to the graph shown here.
Click on the graph information panel button to see the graph boundaries, declarations, and line definition.
Click on at the top of the information panel and change to
Click on the button and change to
Click on the button and change to
Double click on the ![]() icon and the panel should expand as seen below.
icon and the panel should expand as seen below.
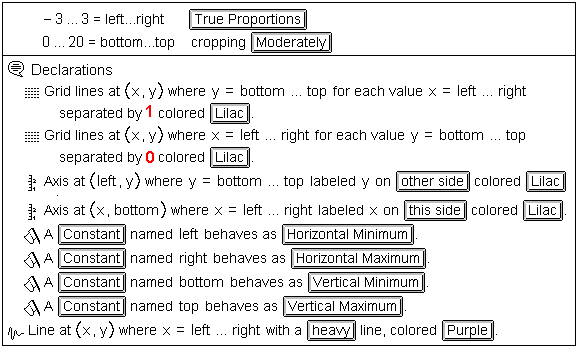
Look for the number 0 in the two ![]() sections. Change each 0 to a 1. In the diagram below this has been
done to the first 0. The zero can be changed either by selecting it and replacing it with
a 1 or by clicking to the right of the zero and backspacing to delete it and then typing a
1.
sections. Change each 0 to a 1. In the diagram below this has been
done to the first 0. The zero can be changed either by selecting it and replacing it with
a 1 or by clicking to the right of the zero and backspacing to delete it and then typing a
1.
Double click the ![]() icon to close the Declarations subpanel and then click on the panel
information icon to close the graph information panel.
icon to close the Declarations subpanel and then click on the panel
information icon to close the graph information panel.
Click to the immediate right of the x in y = ex.
Press the Enter key to get a new ![]() immediately under y = ex.
immediately under y = ex.
Type y shift minus 1 = ln ( x ). The result should be y1 = ln(x)
Click on the equals sign in y1 = ln(x).
Choose the graph menu
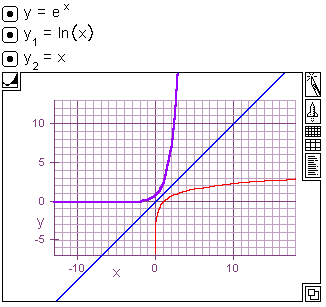
Choose Additional from the graph menu.
Choose Add line plot from the Additional submenu.
Click after the last parentheses in y1 = ln(x) and press Enter again.
Type y shift minus 2 = x to get y2 = x
Click on the equals sign in y2 = x
Choose the Graph è Additional è Add line plot.
Use the rocket ship and the knife to adjust the view to something resembling the view seen.
To get a new notebook choose New notebook from the File menu.
Exercises:
1. Graph y = 6200e(.0.03x – 0.01) + 1000
by typing
y=6200*e^(0.03*x–0.01) +1000.
2. Find the inverse of y = e–3x and graph the function and its inverse in a new notebook. Draw a thumbnail sketch of the functions. Include y = x in the sketch.
3. Find the inverse of y =ln(2x+7) and graph the function and its inverse in a new notebook. Draw a thumbnail sketch of the functions. Include y = x in the sketch.
4. Find the inverse of y = ln( x2 ) and graph the function and its inverse in a new notebook. Draw a thumbnail sketch of the functions. Include y = x in the sketch.
When you are done be sure you close and exit from all notebooks. You do not need to save your notebooks.