Shapes and
Polynomials: Artful Curves
An
appendium to section 3.2 of the MS 100 College Algebra text book:
Polynomial functions of higher degree and their graphs, Algebra and
Trigonometry by Larson, Hostetler, sixth edition.
Polynomials can be
designed to produce specific shapes. The following is a shape that my
son refers to as "batman."
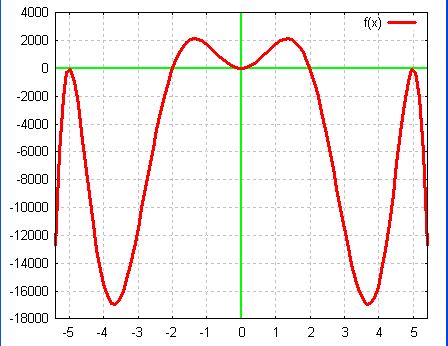
Generating
a particular shape requires knowing something about polynomials
behavior. The first is that the above "opens down" with the
"end behavior" being that the graph "enters and
leaves" from the bottom of the graph. This means we need an
even function such as f(x) = x².
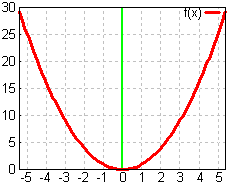
Even
functions are functions in which the largest exponent is an even
number. The simplest even function is f(x) = x².
f(x) = x² enters and leaves from the top of the graph as seen
below on the left, but f(x) = −x² enters and leaves from
the bottom, as seen below on the right. This is due to the order of
operations: the square is applied to the x first, then the negative
sign is applied to the squared value. This is a beginning for
building the "bat" function above.
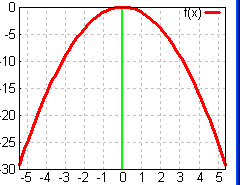
Note
the minus signs were cut off from the y-axis on the graph at the
above right. Note also that the "lead coefficient" for
f(x) = −x² is actually (−1) as in f(x) = (−1)(x²
). Page 273 notes this impact of the sign of the lead coefficient.
To
get a graph to pass through x = ± 5, the graph must have roots
(x-intercepts) at x = ± 5. Remember that for the purposes of
this course that roots, x-intercepts, zero's of a function, and
solutions of a function all mean the same thing: the place a graph
either crosses or touches the horizontal x-axis. This is also
explained on page 275 of the text.
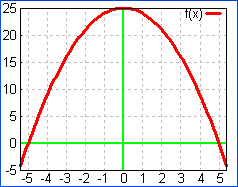
To
get an x-intercept at x = −5, then a factor of (x + 5) is
needed. This is because x = −5 can have 5 added to both sides
to produce x + 5 = 0, which leads back to the factor (x + 5) = 0.
Likewise, x = 5 has corresponding factor (x − 5) = 0. Thus
f(x) = −(x + 5)(x − 5) or f(x) = −x² + 25
yields x-intercepts of x = ± 5. This can be seen in the graph
on the left below.
To
get a graph to touch the x-axis and the "double-back," to
"touch and return," then one needs a double set of
x-intercepts at the same location. This can be seen in the graph on
the above right. This is the result of the following function:
f(x)
= −(x + 5)(x + 5)(x − 5)(x − 5)
Note
the repetition of the factors – this causes the "touch and
return" behavior at x = ± 5. The text book calls these
"touch and return" points "repeated factors" on
page 275. Note too the lead negative to force the function to open
down. The above function can be written two other ways:
f(x)
= −(x + 5)²(x − 5)² or as f(x) = −(x²
− 25)(x² − 25)
Try
that at home, see if you can convert from −(x + 5)(x + 5)(x −
5)(x − 5) to the two forms above. A third way to write this
same double touch at x = ± 5 is multiply the factors out
completely:
f(x)
= −x⁴ + 50x² − 625
Only
in this fully "expanded" form can we determine the
y-intercept which is y = −625 as seen on the graph. Can you
multiply the original factors out to get this result?
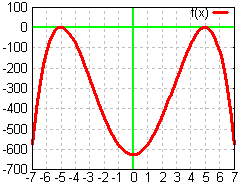
To
get the crossing of the function at x = ± 2 we need two more
factors:
f(x)
= −(x + 5)(x + 5)(x − 5)(x − 5)(x + 2)(x −
2)
This
can be expanded to form:
f(x)
= −x⁶ + 54x⁴ − 825x² + 2500
 This
now looks like the graph on the right.
This
now looks like the graph on the right.
The
final touch is to get the very middle of the graph, the present axis
of symmetry, to do a touch and return on the origin at (0, 0). At
this point graphing really requires a computer as the numbers are
getting too large to work by hand. Note that the curves are smooth
curves, something that would not be revealed if one plotted only the
integer values of the function.
To
get a touch and return at the origin the function must have a double
root at x = 0, or two factors that are both (x − 0 ). Note that
(x − 0 )(x − 0 ) equals x² − 0x + 0 or just
plain old x².
Thus
the function for the original bat curve is:
f(x)
= −(x + 5)(x + 5)(x − 5)(x − 5)(x + 2)(x −
2)(x − 0 )(x − 0 )
or
f(x)
= −(x + 5)(x + 5)(x − 5)(x − 5)(x + 2)(x −
2) x²
more
often written:
f(x)
= −x²(x + 2)(x − 2) (x + 5)² (x − 5)²
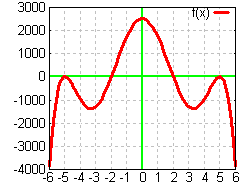
This
multiplies out to:
f(x)
= −x⁸ + 54x⁶ − 825x⁴ +2500x²
This
function generates the original "bat" function seen at the
start of this paper.
Some
parting ideas:
To
open down one needs an even function with a negative lead
coefficient
To
open up one needs an even function with a positive lead coefficient
To
cross the x-axis one needs a factor corresponding to the crossing
value
To
touch and return from the x-axis one needs a factor squared
that corresponds to the value at the touch and return point.
The
use of x-intercepts that are equally distant left and right from the
y-axis generates symmetric polynomials with the y-axis as the axis
of symmetry such as those seen in this paper.
Produced
using GnuPlot 4.0, Maxima 5.9.2, and OpenOffice.org 2.0.2.
Gnuplot
is a portable command-line driven interactive data and function
plotting utility. The software is copyrighted but freely distributed
(i.e., you don't have to pay for it). It was originally intended as
to allow scientists and students to visualize mathematical functions
and data. Gnuplot has been supported and under development since
1986.
Maxima
is a fairly complete computer algebra system written in lisp with an
emphasis on symbolic computation. It is based on DOE-MACSYMA and
licensed under the General Public License. Its abilities include
symbolic integration, 3D plotting, and an ODE solver.
OpenOffice.org
is a multiplatform and multilingual office suite and an open-source
project. Compatible with all other major office suites, the product
is free to download, use, and distribute.
http://www.gnuplot.info/
http://maxima.sourceforge.net/
http://www.openoffice.org/
-
Dana Lee Ling, spring 2006