| Outref | Students will be able to: | Sum | Count | Avg |
| Pre | [Preliminary skill] | 8.89 | 11 | 0.81 |
| 1_ | Graph and solve linear and quadratic equations and inequalities including those with complex roots. | 2.3 | 6 | 0.38 |
| 1a | Sketch the graph of an equation | 2.63 | 5 | 0.53 |
| 1b | Solve linear, quadratic, polynomial, and radical equations. | 12.11 | 23 | 0.53 |
| 1c | Perform operations with complex numbers. | 2.91 | 4 | 0.73 |
| 1d | Solve linear, quadratic, polynomial, and radical inequalities. | 1.55 | 2 | 0.77 |
| 2_ | Evaluate and analyze functions and their graphs including combinations and compositions of functions. | 1.09 | 2 | 0.55 |
| 2a | Find and use slopes of lines to write and graph linear equations in two variables. | 1.82 | 3 | 0.61 |
| 2b | Evaluate functions and find their domains. | 1.26 | 3 | 0.42 |
| 2c | Analyze the graphs of functions. | 8.64 | 13 | 0.66 |
| 2d | Find arithmetic combinations and compositions of functions. | 4.69 | 7 | 0.67 |
| 2e | Identify inverse functions graphically and find inverse functions algebraically. | 0.36 | 2 | 0.18 |
| 3_ | Sketch and analyze graphs of polynomial functions and mathematical models of variation. | 1.71 | 4 | 0.43 |
| 3a | Sketch and analyze graphs of polynomial functions | 3.2 | 5 | 0.64 |
| 3b | Use long division to divide polynomials | 0.7 | 1 | 0.7 |
| 3c | Write mathematical models for direct, inverse, and joint variation. | 1.95 | 4 | 0.49 |
| 4_ | Determine the domains of rational functions, find asymptotes, and sketch the graphs of rational functions. | 1.63 | 3 | 0.54 |
| 4a | Find the domains of rational functions. | 0 | 0 | 0 |
| 4b | Find the horizontal and vertical asymptotes for graphs of rational functions. | 0.7 | 2 | 0.35 |
| 4c | Recognize graphs of circles, ellipses, parabolas, and hyperbolas. | 12.64 | 20 | 0.63 |
| 5_ | Beyond the outline | 1 | 2 | 0.5 |
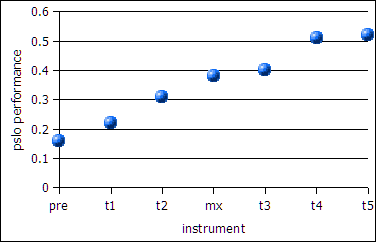
| PSLO | define mathematical concepts, calculate quantities, estimate solutions, solve problems, represent and interpret mathematical information graphically, and communicate mathematical thoughts and ideas. | 0.52 |
| Source | Q | Description | Outref | SLO | Corr | Corr% |
| t5 | 1a | identify conic shape from graph | 4c | Recognize graphs of circles, ellipses, parabolas, and hyperbolas. | 7 | 0.88 |
| t5 | 1b | identify conic shape from graph | 4c | Recognize graphs of circles, ellipses, parabolas, and hyperbolas. | 7 | 0.88 |
| t5 | 2a | identify conic shape from equation | 4c | Recognize graphs of circles, ellipses, parabolas, and hyperbolas. | 7 | 0.88 |
| t5 | 2b | identify conic shape from equation | 4c | Recognize graphs of circles, ellipses, parabolas, and hyperbolas. | 8 | 1 |
| t5 | 2c | identify conic shape from equation | 4c | Recognize graphs of circles, ellipses, parabolas, and hyperbolas. | 8 | 1 |
| t5 | 2d | identify conic shape from equation | 4c | Recognize graphs of circles, ellipses, parabolas, and hyperbolas. | 7 | 0.88 |
| t5 | 2e | convert conic form parabola to vertex form | 4c | Recognize graphs of circles, ellipses, parabolas, and hyperbolas. | 1 | 0.13 |
| t5 | 2f | find focus distance p | 5_ | Beyond the outline | 2 | 0.25 |
| t5 | 2g | find parabola vertex (h,k) | 4c | Recognize graphs of circles, ellipses, parabolas, and hyperbolas. | 2 | 0.25 |
| t5 | 2h | find circle center (h, k) | 4c | Recognize graphs of circles, ellipses, parabolas, and hyperbolas. | 5 | 0.63 |
| t5 | 2i | find radius | 4c | Recognize graphs of circles, ellipses, parabolas, and hyperbolas. | 5 | 0.63 |
| t5 | 2j | graph circle | 4_ | Determine the domains of rational functions, find asymptotes, and sketch the graphs of rational functions. | 5 | 0.63 |
| t5 | 3 | solve simultaneous equations in two unknowns | 5_ | Beyond the outline | 6 | 0.75 |
Report on outline outcomes accomplished with aggregate program student learning outcome at bottom:
Outref Students will be able to: Sum Count Avg Pre [Preliminary skill] 8.89 11 0.81 1_ Graph and solve linear and quadratic equations and inequalities including those with complex roots. 2.3 6 0.38 1a Sketch the graph of an equation 2.63 5 0.53 1b Solve linear, quadratic, polynomial, and radical equations. 12.11 23 0.53 1c Perform operations with complex numbers. 2.91 4 0.73 1d Solve linear, quadratic, polynomial, and radical inequalities. 1.55 2 0.77 2_ Evaluate and analyze functions and their graphs including combinations and compositions of functions. 1.09 2 0.55 2a Find and use slopes of lines to write and graph linear equations in two variables. 1.82 3 0.61 2b Evaluate functions and find their domains. 1.26 3 0.42 2c Analyze the graphs of functions. 8.64 13 0.66 2d Find arithmetic combinations and compositions of functions. 4.69 7 0.67 2e Identify inverse functions graphically and find inverse functions algebraically. 0.36 2 0.18 3_ Sketch and analyze graphs of polynomial functions and mathematical models of variation. 1.71 4 0.43 3a Sketch and analyze graphs of polynomial functions 3.2 5 0.64 3b Use long division to divide polynomials 0.7 1 0.7 3c Write mathematical models for direct, inverse, and joint variation. 1.95 4 0.49 4_ Determine the domains of rational functions, find asymptotes, and sketch the graphs of rational functions. 1 2 0.5 4a Find the domains of rational functions. 0 0 0 4b Find the horizontal and vertical asymptotes for graphs of rational functions. 0.7 2 0.35 4c Recognize graphs of circles, ellipses, parabolas, and hyperbolas. 5.52 10 0.55 PSLO define mathematical concepts, calculate quantities, estimate solutions, solve problems, represent and interpret mathematical information graphically, and communicate mathematical thoughts and ideas.
0.51
I am always reminded of the Hitchhiker's Guide to the Galaxy when I see numbers up around 50%. In the book the answer to the meaning of life is 42, and that morphed into a social idiom that the answer to any problem for which the answer is not known is 42.
In 1992 Dr.Perry noted that half of the students will fail college algebra no matter what effort one makes. In the early 2000's my program learning outcomes assessment tool yielded aggregate outcome assessment rates of around 53% to 56%. Here in 2006 my aggregate program student learning outcome is headed towards a similar number as the summer term heads to a close: 51%.
Any measurement of actual math learning at the college level appears to be stuck at around 50%.
Item analysis for test four:
Source Q Description Outref SLO Corr Corr%
t4 1 convert quadratic to (y-k)=m(x-h)² 3_ Sketch and analyze graphs of polynomial functions and mathematical models of variation. 6 0.6 t4 2 find parabola vertex (h,k) 4c Recognize graphs of circles, ellipses, parabolas, and hyperbolas. 6 0.6 t4 3 convert quadratic to (y-k)=m(x-h)² 3_ Sketch and analyze graphs of polynomial functions and mathematical models of variation. 2 0.2 t4 4 find parabola vertex (h,k) 4c Recognize graphs of circles, ellipses, parabolas, and hyperbolas. 1 0.1 t4 5 divide polynomial by long division 3b Use long division to divide polynomials 7 0.7 t4 6 determine number of linear factors 3a Sketch and analyze graphs of polynomial functions 6 0.6 t4 7 determine number zeros 3a Sketch and analyze graphs of polynomial functions 8 0.8 t4 8 determine number of linear factors 3a Sketch and analyze graphs of polynomial functions 6 0.6 t4 9 determine number zeros 3a Sketch and analyze graphs of polynomial functions 7 0.7 t4 10 determine number zeros 3a Sketch and analyze graphs of polynomial functions 5 0.5 t4 11a find y-intercept rational fcn 4_ Determine the domains of rational functions, find asymptotes, and sketch the graphs of rational functions. 5 0.5 t4 11b find x-intercept rational fcn 4_ Determine the domains of rational functions, find asymptotes, and sketch the graphs of rational functions. 5 0.5 t4 11c find vertical asymptotes 4b Find the horizontal and vertical asymptotes for graphs of rational functions. 3 0.3 t4 11d find horizontal asymptotes 4b Find the horizontal and vertical asymptotes for graphs of rational functions. 4 0.4
Test four is available as an open office document upon request.
Dana Lee Ling wrote:In my ongoing series of reports on trying to track and report learning in near real-time, I offer the latest installation of my progress on the MS 100 outline. Feel free to delete this. I only report this as I feel as this is providing useful information for me directly, while also reporting on learning to those higher in the assessment food chain than I. I think this is a way forward for the math and science division.
Once I return to Palikir I will be suggesting to those in the math science division that they item analyze a representative sample of their final examinations, map the questions back to the outline, and use the item analysis to report on learning accomplished against the outline outcomes, much as I have done below.
While an item analysis of the final is certainly not the only way to assess a course and I am open to faculty developing their own assessment strategy in the division, ultimately I need a way to report on learning as specified in the outlines. If an individual faculty member in the national division does not have an alternate strategy that accomplishes this, then I would be requiring an item analysis of a representative sample of final examinations each term.
Report on outline outcomes accomplished with aggregate program student learning outcome at bottom:
Outref Students will be able to: Sum Count Avg Pre [Preliminary skill] 8.89 11 0.81 1_ Graph and solve linear and quadratic equations and inequalities including those with complex roots. 2.3 6 0.38 1a Sketch the graph of an equation 2.63 5 0.53 1b Solve linear, quadratic, polynomial, and radical equations. 12.11 23 0.53 1c Perform operations with complex numbers. 2.91 4 0.73 1d Solve linear, quadratic, polynomial, and radical inequalities. 1.55 2 0.77 2_ Evaluate and analyze functions and their graphs including combinations and compositions of functions. 1.09 2 0.55 2a Find and use slopes of lines to write and graph linear equations in two variables. 1.82 3 0.61 2b Evaluate functions and find their domains. 1.26 3 0.42 2c Analyze the graphs of functions. 8.64 13 0.66 2d Find arithmetic combinations and compositions of functions. 4.69 7 0.67 2e Identify inverse functions graphically and find inverse functions algebraically. 0.36 2 0.18 3_ Sketch and analyze graphs of polynomial functions and mathematical models of variation. 0.91 2 0.45 3a Sketch and analyze graphs of polynomial functions 0 0 0 3b Use long division to divide polynomials 0 0 0 3c Write mathematical models for direct, inverse, and joint variation. 1.95 4 0.49 4_ Determine the domains of rational functions, find asymptotes, and sketch the graphs of rational functions. 0 0 0 4a Find the domains of rational functions. 0 0 0 4b Find the horizontal and vertical asymptotes for graphs of rational functions. 0 0 0 4c Recognize graphs of circles, ellipses, parabolas, and hyperbolas. 4.82 8 0.6 PSLO define mathematical concepts, calculate quantities, estimate solutions, solve problems, represent and interpret mathematical information graphically, and communicate mathematical thoughts and ideas.
0.4
Report on test three:
Source Q Description Outref SLO Corr Corr%
t3 1 find parabola vertex (h,k) 4c Recognize graphs of circles, ellipses, parabolas, and hyperbolas. 9 0.82 t3 2 find zeros of function 1b Solve linear, quadratic, polynomial, and radical equations. 6 0.55 t3 3 graph quadratic 1a Sketch the graph of an equation 4 0.36 t3 4 convert quadratic to (y-k)=m(x-h)² 3_ Sketch and analyze graphs of polynomial functions and mathematical models of variation. 6 0.55 t3 5 analyze graph: find quadratic fcn 2c Analyze the graphs of functions. 1 0.09 t3 6 draw conclusion 3_ Sketch and analyze graphs of polynomial functions and mathematical models of variation. 4 0.36 t3 7 find composition of functions 2d Find arithmetic combinations and compositions of functions. 4 0.36 t3 8a add functions 2d Find arithmetic combinations and compositions of functions. 10 0.91 t3 8b divide functions 2d Find arithmetic combinations and compositions of functions. 5 0.45 t3 8c square a function 2d Find arithmetic combinations and compositions of functions. 9 0.82 t3 8d find composition of functions 2d Find arithmetic combinations and compositions of functions. 6 0.55 t3 8e find composition of functions 2d Find arithmetic combinations and compositions of functions. 8 0.73 t3 8f evaluate composition of functions 2b Evaluate functions and find their domains. 4 0.36 t3 8g vertical line test 2c Analyze the graphs of functions. 10 0.91 t3 8h horizontal line test 2c Analyze the graphs of functions. 8 0.73 t3 8i vertical line test 2c Analyze the graphs of functions. 8 0.73 t3 8j horizontal line test 2c Analyze the graphs of functions. 9 0.82 t3 8k find inverse function using comp 2e Identify inverse functions graphically and find inverse functions algebraically. 4 0.36 t3 8l find inverse function using comp 2e Identify inverse functions graphically and find inverse functions algebraically. 0 0
Test three is available as an open office document upon request. I hope to eventually produce PDF versions of my tests and get them posted on line for those who do not use OpenOffice. I cannot produce Microsoft Word variants without a significant loss in formatting due to my use of the mathematics equation editor in OpenOffice which implements standards based MathML - something Microsoft Word does not support at this time.
Dana Lee Ling wrote:I continue to find that my item analysis approach yield solid data. The analysis provides information on coverage of the outline and performance on the outline objectives. I may present my efforts to the division early next term - I think this may be a way forward for many in the division in the effort to report learning up from our classrooms.
Midterm item analysis:
Source Q Description Outref SLO Corr Corr%
mx 1a find y-intercept quadratic 1b Solve linear, quadratic, polynomial, and radical equations. 9 0.82 mx 1b find x-intercept quadratic 1b Solve linear, quadratic, polynomial, and radical equations. 7 0.64 mx 1c find degree pre [Preliminary skill] 9 0.82 mx 1d identify lead coefficient pre [Preliminary skill] 10 0.91 mx 1e graph quadratic 1a Sketch the graph of an equation 9 0.82 mx 1f find slope quad given formula 1b Solve linear, quadratic, polynomial, and radical equations. 6 0.55 mx 1g find h from slope=0: vertex x 1b Solve linear, quadratic, polynomial, and radical equations. 7 0.64 mx 1h find k from vertex x 1b Solve linear, quadratic, polynomial, and radical equations. 3 0.27 mx 1i graph quadratic 1a Sketch the graph of an equation 4 0.36 mx 1j analyze graph: inc/dec 2c Analyze the graphs of functions. 3 0.27 mx 1k analyze graph: min/max 2c Analyze the graphs of functions. 5 0.45 mx 1l analyze graph: curvature 2c Analyze the graphs of functions. 9 0.82 mx 1m analyze graph: inflection 2c Analyze the graphs of functions. 5 0.45 mx 1n identify shape of function 4c Recognize graphs of circles, ellipses, parabolas, and hyperbolas. 9 0.82 mx 1o analyze graph: vertical line test 2c Analyze the graphs of functions. 9 0.82 mx 1p analyze graph: function? 2c Analyze the graphs of functions. 10 0.91 mx 1q find irrational factors quadratic 1_ Graph and solve linear and quadratic equations and inequalities including those with complex roots. 1 0.09 mx 2a find circle center (h, k) 4c Recognize graphs of circles, ellipses, parabolas, and hyperbolas. 6 0.55 mx 2b find radius 4c Recognize graphs of circles, ellipses, parabolas, and hyperbolas. 7 0.64 mx 3 Solve quadratic imaginary roots 1_ Graph and solve linear and quadratic equations and inequalities including those with complex roots. 2 0.18 mx 4 multiply complex numbers 1c Perform operations with complex numbers. 7 0.64 mx 5 solve for radical 1b Solve linear, quadratic, polynomial, and radical equations. 0 0 mx 6 solve linear inequality 1d Solve linear, quadratic, polynomial, and radical inequalities. 7 0.64 mx 7 find linear from two coordinates 2a Find and use slopes of lines to write and graph linear equations in two variables. 8 0.73 mx 8 determine parallel, perpendicular 2a Find and use slopes of lines to write and graph linear equations in two variables. 6 0.55 mx 9 determine parallel, perpendicular 2a Find and use slopes of lines to write and graph linear equations in two variables. 6 0.55 mx 10a calculate ratio pre [Preliminary skill] 10 0.91 mx 10b percentage change 3c Write mathematical models for direct, inverse, and joint variation. 4 0.36 mx 10c draw conclusion 2_ Evaluate and analyze functions and their graphs including combinations and compositions of functions. 9 0.82 mx 11a analyze graph: even/odd 2c Analyze the graphs of functions. 8 0.73 mx 11b analyze graph: zeroes 2c Analyze the graphs of functions. 10 0.91
Updated outline impact:
Outref Students will be able to: Sum Count Avg Pre [Preliminary skill] 8.89 11 0.81 1_ Graph and solve linear and quadratic equations and inequalities including those with complex roots. 2.3 6 0.38 1a Sketch the graph of an equation 2.27 4 0.57 1b Solve linear, quadratic, polynomial, and radical equations. 11.57 22 0.53 1c Perform operations with complex numbers. 2.91 4 0.73 1d Solve linear, quadratic, polynomial, and radical inequalities. 1.55 2 0.77 2_ Evaluate and analyze functions and their graphs including combinations and compositions of functions. 1.09 2 0.55 2a Find and use slopes of lines to write and graph linear equations in two variables. 1.82 3 0.61 2b Evaluate functions and find their domains. 0.9 2 0.45 2c Analyze the graphs of functions. 5.36 8 0.67 2d Find arithmetic combinations and compositions of functions. 0.88 1 0.88 2e Identify inverse functions graphically and find inverse functions algebraically. 0 0 0 3_ Sketch and analyze graphs of polynomial functions and mathematical models of variation. 0 0 0 3a Sketch and analyze graphs of polynomial functions 0 0 0 3b Use long division to divide polynomials 0 0 0 3c Write mathematical models for direct, inverse, and joint variation. 1.95 4 0.49 4_ Determine the domains of rational functions, find asymptotes, and sketch the graphs of rational functions. 0 0 0 4a Find the domains of rational functions. 0 0 0 4b Find the horizontal and vertical asymptotes for graphs of rational functions. 0 0 0 4c Recognize graphs of circles, ellipses, parabolas, and hyperbolas. 4 7 0.57 PSLO define mathematical concepts, calculate quantities, estimate solutions, solve problems, represent and interpret mathematical information graphically, and communicate mathematical thoughts and ideas.
0.38
Dana Lee Ling wrote:Friday I gave test two. The following are the results, eleven of twelve students took the text. The percentages are out of eleven.
Item analysis:
Source Q Description Outref SLO Corr Corr% t2 1 Solve quadratic 1b Solve linear, quadratic, polynomial, and radical equations. 6 0.55 t2 2 Solve quadratic 1b Solve linear, quadratic, polynomial, and radical equations. 6 0.55 t2 3 Solve quadratic imaginary roots 1_ Graph and solve linear and quadratic equations and inequalities including those with complex roots. 3 0.27 t2 4 add complex numbers 1c Perform operations with complex numbers. 9 0.82 t2 5 multiply complex numbers 1c Perform operations with complex numbers. 10 0.91 t2 6 multiply complex factors 1c Perform operations with complex numbers. 6 0.55 t2 7 solve for radical 1b Solve linear, quadratic, polynomial, and radical equations. 7 0.64 t2 8 solve linear inequality 1d Solve linear, quadratic, polynomial, and radical inequalities. 10 0.91 t2 9a find y-intercept quadratic 1b Solve linear, quadratic, polynomial, and radical equations. 7 0.64 t2 9b Solve quadratic 1b Solve linear, quadratic, polynomial, and radical equations. 3 0.27 t2 9c solve slope equation 1b Solve linear, quadratic, polynomial, and radical equations. 3 0.27 t2 9d evaluate polynomial 2b Evaluate functions and find their domains. 3 0.27 t2 9e draw conclusion 2_ Evaluate and analyze functions and their graphs including combinations and compositions of functions. 3 0.27
Updated outline impact:
Outref Students will be able to: Sum Count Avg Pre [Preliminary skill] 6.25 8 0.78 1_ Graph and solve linear and quadratic equations and inequalities including those with complex roots. 2.02 4 0.51 1a Sketch the graph of an equation 1.08 2 0.54 1b Solve linear, quadratic, polynomial, and radical equations. 8.66 16 0.54 1c Perform operations with complex numbers. 2.27 3 0.76 1d Solve linear, quadratic, polynomial, and radical inequalities. 0.91 1 0.91 2_ Evaluate and analyze functions and their graphs including combinations and compositions of functions. 0.27 1 0.27 2a Find and use slopes of lines to write and graph linear equations in two variables. 0 0 0 2b Evaluate functions and find their domains. 0.9 2 0.45 2c Analyze the graphs of functions. 0 0 0 2d Find arithmetic combinations and compositions of functions. 0.88 1 0.88 2e Identify inverse functions graphically and find inverse functions algebraically. 0 0 0 3_ Sketch and analyze graphs of polynomial functions and mathematical models of variation. 0 0 0 3a Sketch and analyze graphs of polynomial functions 0 0 0 3b Use long division to divide polynomials 0 0 0 3c Write mathematical models for direct, inverse, and joint variation. 1.58 3 0.53 4_ Determine the domains of rational functions, find asymptotes, and sketch the graphs of rational functions. 0 0 0 4a Find the domains of rational functions. 0 0 0 4b Find the horizontal and vertical asymptotes for graphs of rational functions. 0 0 0 4c Recognize graphs of circles, ellipses, parabolas, and hyperbolas. 2 4 0.5 PSLO define mathematical concepts, calculate quantities, estimate solutions, solve problems, represent and interpret mathematical information graphically, and communicate mathematical thoughts and ideas.
0.31
Test two exists only as an Open Document text file produced by OpenOffice 2.0 and is available in that format upon request.