MS 100 College Algebra item analysis
The following table reports an item analysis for MS College Algebra final examinations from three instructors as aggregated by student learning outcomes on the outline. The first column references the outline. "1_" refers to final exam items that met course level outcome 1 but were not easily assigned to a specific learning outcome (1a, 1b, etc.). The fac columns represent averages for a given faculty member, the names were stripped out to keep the data anonymous as per Dr. Mary Allen's advice in her books. The z column is not a true z but rather represents standard errors away from the mean. Cond refers to whether the average might be considered low, high, or ordinary - not unusually high or low. The distribution of averages was uniform, not at all a normal distribution, hence the large number of items that were either high or low. Performance simply varied widely on items.
| Outline |
fac1 |
fac2 |
fac3 |
Overall |
z |
cond |
Students will be able to: |
| 1_ |
0.72 |
|
0.38 |
0.60 |
3.28 |
high |
Graph and solve linear and quadratic equations and inequalities including those with complex roots. |
| 1a |
0.43 |
0.17 |
0.44 |
0.33 |
-4.31 |
low |
Sketch the graph of an equation |
| 1b |
0.70 |
0.36 |
0.30 |
0.47 |
-0.33 |
ordinary |
Solve linear, quadratic, polynomial, and radical equations. |
| 1c |
0.47 |
0.31 |
0.38 |
0.39 |
-2.69 |
low |
Perform operations with complex numbers. |
| 1d |
|
0.76 |
|
0.76 |
7.60 |
high |
Solve linear, quadratic, polynomial, and radical inequalities. |
| 2_ |
0.54 |
0.41 |
0.81 |
0.65 |
4.64 |
high |
Evaluate and analyze functions and their graphs including combinations and compositions of functions. |
| 2a |
0.57 |
0.46 |
|
0.48 |
0.00 |
ordinary |
Find and use slopes of lines to write and graph linear equations in two variables. |
| 2b |
0.74 |
|
0.39 |
0.64 |
4.38 |
high |
Evaluate functions and find their domains. |
| 2c |
0.59 |
0.57 |
|
0.59 |
2.87 |
high |
Analyze the graphs of functions. |
| 2d |
0.31 |
0.44 |
0.43 |
0.40 |
-2.18 |
low |
Find arithmetic combinations and compositions of functions. |
| 2e |
0.15 |
0.30 |
0.13 |
0.22 |
-7.27 |
low |
Identify inverse functions graphically and find inverse functions algebraically. |
| 3_ |
|
0.24 |
|
0.24 |
-6.70 |
low |
Sketch and analyze graphs of polynomial functions and mathematical models of variation. |
| 3a |
0.46 |
0.26 |
0.61 |
0.46 |
-0.74 |
ordinary |
Sketch and analyze graphs of polynomial functions |
| 3b |
|
0.62 |
0.63 |
0.62 |
3.82 |
high |
Use long division to divide polynomials |
| 3c |
|
0.36 |
|
0.36 |
-3.30 |
low |
Write mathematical models for direct, inverse, and joint variation. |
| 4_ |
|
0.38 |
0.50 |
0.44 |
-1.26 |
ordinary |
Determine the domains of rational functions, find asymptotes, and sketch the graphs of rational functions. |
| 4a |
|
|
|
|
|
|
Find the domains of rational functions. (Not asked on any final). |
| 4b |
|
0.26 |
0.28 |
0.27 |
-5.85 |
low |
Find the horizontal and vertical asymptotes for graphs of rational functions. |
| 4c |
|
0.29 |
0.44 |
0.41 |
-1.94 |
ordinary |
Recognize graphs of circles, ellipses, parabolas, and hyperbolas. |
| Avg: |
0.58 |
0.37 |
0.48 |
0.48 |
0.00 |
ordinary |
|
The upshot is that we now know where students tend to be weaker and where they tend to be stronger. We also have a value of 48% that can be reported, on aggregate, for the mathematics program learning outcome.
That 48% reminds me of the following chart, presented at the November 25 mathematics meeting:
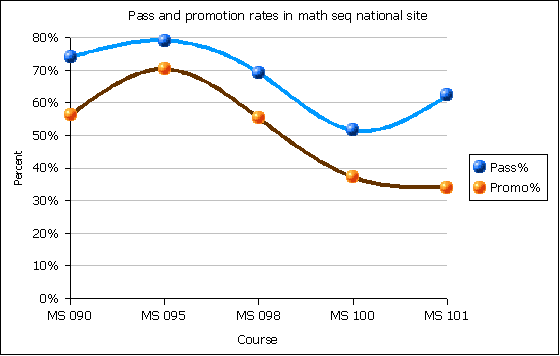
The chart shows results for students passing (D or better) or being eligible for the next course (C or better) for all students spring 2004 to fall 2005. Note the pass rate for MS 100 over this period is around 52%. Half of the students (48%) are able to correctly answer final examination questions (on aggregate) and half of the students (52%) have passed the course on a historical basis. Qualified faculty implementing courses based on student learning outcomes produce trusted grades. Grades have meaning. Where qualified instructors implement courses based on student learning outcome, grades can be used as a valid assessment of student learning - on aggregate.
This is not to say we can dispense with formative assessment - the data above provides each of us who teaches MS 100 useful information on where students tend to succeed or fail. This is valuable. On aggregate, however, grades also have a learning meaning.
The following is a table where each row is a question on a final. The table includes the instructor's original description and the outline item I assigned to that item. For the benefit of those who might wish to quibble with my choices, the table below could be copied to a spreadsheet, changes could be made, and the result could be re-pivoted to produce a variation of the above.
| Corr |
Corr% |
Topic |
Outline |
| 12 |
0.75 |
y-intercept for quadratic |
2_ |
| 9 |
0.56 |
x-intercepts for quadratic |
1b |
| 1 |
0.06 |
type of symmetry |
2b |
| 6 |
0.38 |
example of system |
1_ |
| 5 |
0.31 |
name of shape from equation (circle) |
4c |
| 8 |
0.50 |
radius from equation |
4c |
| 4 |
0.25 |
coordinates of center (h, k) |
4c |
| 7 |
0.44 |
name of shape from equation (ellipse) |
4c |
| 5 |
0.31 |
solve linear equation for x |
1b |
| 2 |
0.13 |
word problem, linear |
1b |
| 6 |
0.38 |
complete the square, imaginary roots |
1b |
| 6 |
0.38 |
multiply two complex numbers |
1c |
| 0 |
0.00 |
solve equation involving square roots |
1b |
| 10 |
0.63 |
add two functions |
2d |
| 10 |
0.63 |
subtract two functions |
2d |
| 11 |
0.69 |
multiply two functions |
2d |
| 6 |
0.38 |
divide two functions |
2d |
| 6 |
0.38 |
square a function |
2d |
| 2 |
0.13 |
compose two functions (composition) |
2d |
| 3 |
0.19 |
compose two functions (composition) |
2d |
| 14 |
0.88 |
vertical line test/quadratic |
3a |
| 10 |
0.63 |
horizontal line test/quadratic |
3a |
| 8 |
0.50 |
vertical line test/linear |
3a |
| 10 |
0.63 |
horizontal line test/linear |
3a |
| 2 |
0.13 |
find f¯¹(x) of a linear function |
2e |
| 10 |
0.63 |
polynomial long division |
3b |
| 12 |
0.75 |
y-intercept for a cubic |
2b |
| 12 |
0.75 |
lead coef cubic positive or negative? |
2_ |
| 12 |
0.75 |
cubic is even or odd? |
2_ |
| 9 |
0.56 |
y-intercept for a rational function |
4_ |
| 7 |
0.44 |
x-intercept for a rational function |
4_ |
| 5 |
0.31 |
vertical asymptotes for a rational fcn |
4b |
| 4 |
0.25 |
horizontal asymptote for a rational fcn |
4b |
| 1 |
0.06 |
complete the square, imaginary irrational roots |
1b |
| 16 |
1.00 |
quadratic: degree? |
2_ |
| 15 |
0.94 |
quadratic: even or odd? |
2_ |
| 15 |
0.94 |
quadratic: open up or down? |
2_ |
| 10 |
0.63 |
quadratic: maximum number of possible zeroes? |
2_ |
| 11 |
0.69 |
name of shape from equation (parabola) |
4c |
| 12 |
0.75 |
y-intercept for a quadratic |
2_ |
| 8 |
0.50 |
complete the square: rational roots |
1b |
| 8 |
0.50 |
x-intercept for a quadratic function |
1b |
| 6 |
0.38 |
use vertex formula to find vertex of quadratic |
2b |
| 6 |
0.38 |
use focus formula to find focus of quadratic |
2b |
| 7 |
0.44 |
sketch a quadratic |
3a |
| 7 |
0.44 |
sketch a quadratic |
1a |
| 29 |
0.97 |
Solve a linear equation 3x + 2 = 5x - 9 |
1b |
| 27 |
0.90 |
Solve the linear equation ax + b = 0 |
1b |
| 19 |
0.63 |
Find a percentage increase |
1_ |
| 24 |
0.80 |
Find a percentage |
1_ |
| 17 |
0.57 |
Find dimensions of a rectangle |
1b |
| 22 |
0.73 |
Solve quadratic by factoring |
1b |
| 17 |
0.57 |
Solve quadratic by Quadratic Formula |
1b |
| 18 |
0.60 |
Subtract imaginary numbers |
1c |
| 10 |
0.33 |
Multiply imaginary numbers |
1c |
| 24 |
0.80 |
Test a solution to equation with radical |
2b |
| 20 |
0.67 |
Test a solution to equation with square |
2b |
| 12 |
0.40 |
Estimate slope by inspecting graph |
2c |
| 17 |
0.57 |
Identify positive or negative slope |
2_ |
| 29 |
0.97 |
Is the table a function? |
2b |
| 23 |
0.77 |
Is the table a function? |
2b |
| 18 |
0.60 |
Is the table a function? |
2b |
| 15 |
0.50 |
Is the table a function? |
2b |
| 19 |
0.63 |
Does the equation represent a function? |
2_ |
| 13 |
0.43 |
Does the equation represent a function? |
2_ |
| 10 |
0.33 |
Find the zeros of a linear function |
1b |
| 24 |
0.80 |
Find f(0) for a linear function |
1b |
| 25 |
0.83 |
Evaluate a function at a specific value |
2b |
| 23 |
0.77 |
Evaluate a function at a specific value |
2b |
| 25 |
0.83 |
Evaluate a function at a specific value |
2b |
| 21 |
0.70 |
Evaluate a function at a specific value |
2b |
| 12 |
0.40 |
Given the graph, is a number in the domain? |
2c |
| 17 |
0.57 |
Given the graph, is a number in the domain? |
2c |
| 19 |
0.63 |
Given the graph, is it increasing? |
2c |
| 18 |
0.60 |
Given the graph, is a number in the range? |
2c |
| 23 |
0.77 |
Given the graph, is a number in the range? |
2c |
| 23 |
0.77 |
Given the graph, find f(2) |
2c |
| 4 |
0.13 |
Given the graph, identify the zeros |
3a |
| 25 |
0.83 |
Given a graph, identify the zeros |
3a |
| 17 |
0.57 |
Find the formula of linear function given two points |
2a |
| 10 |
0.33 |
Sketch the graph of a quadratic |
3a |
| 10 |
0.33 |
Sketch the graph of a quadratic |
1a |
| 16 |
0.53 |
Sketch the graph of a quadratic |
3a |
| 16 |
0.53 |
Sketch the graph of a quadratic |
1a |
| 12 |
0.40 |
Compose two functions -- f with g |
2d |
| 11 |
0.37 |
Compose two functions -- g with f |
2d |
| 5 |
0.17 |
Evaluate a composite function |
2d |
| - |
0.00 |
Explain the meaning of inverse function |
2e |
| 9 |
0.30 |
Find inverse of a linear function |
2e |
| 27 |
0.76 |
Find ( f+g)(2) |
2d |
| 12 |
0.33 |
domain of (f/g)(x) |
2d |
| 8 |
0.23 |
composition of f and g |
2d |
| 12 |
0.33 |
inverse of f |
2e |
| 8 |
0.23 |
verify the composition of f and its inverse is the identity fn 23% |
2e |
| 27 |
0.76 |
Solve the inequality and sketch the solution |
1d |
| 12 |
0.33 |
operations of complex nos. |
1c |
| 10 |
0.29 |
find the center and raduis of the circle |
4c |
| 17 |
0.48 |
find the equation of the line |
2a |
| 26 |
0.71 |
determine whether two lines are parallel |
2a |
| 8 |
0.23 |
perpendicular |
2a |
| 15 |
0.43 |
neither |
2a |
| 14 |
0.38 |
write the quadratic fn in std form by completing the square38% |
1b |
| 9 |
0.24 |
identify the vertex and x-intercept |
3_ |
| 5 |
0.14 |
sketch the graph |
3a |
| 5 |
0.14 |
sketch the graph |
1a |
| 10 |
0.29 |
zeros(real or complex) of polynomial fn |
1c |
| 15 |
0.43 |
inverse variation |
3c |
| 15 |
0.43 |
direct variation |
3c |
| 8 |
0.23 |
joint variation |
3c |
| 21 |
0.57 |
right and left hand behavior of the graph |
2c |
| 22 |
0.62 |
if the given linear fn is a factor using long division or synthetic div & remainder thm |
3b |
| 14 |
0.38 |
write the linear factorization of g(x) |
3a |
| 12 |
0.33 |
find all real zeros and multiplicity of each |
1b |
| 15 |
0.43 |
find the y-intercept |
2_ |
| 7 |
0.19 |
sketch the graph |
3a |
| 7 |
0.19 |
sketch the graph |
1a |
| 12 |
0.33 |
turning points |
3a |
| 27 |
0.76 |
Is g(x) a function? |
2_ |
| 12 |
0.33 |
Is the inverse also a fn? |
2e |
| 8 |
0.23 |
Is it even or odd? |
2_ |
| 8 |
0.23 |
Does the graph have symmetry |
2_ |
| 19 |
0.52 |
Identify the x&y-int or rational fn |
4_ |
| 10 |
0.29 |
vertical asymptotes |
4b |
| 8 |
0.23 |
horizontal asymptotes |
4b |
| 8 |
0.23 |
sketch the graph of rational fn |
4_ |
|
|
Not asked by any instructor: |
4a |