Illustration
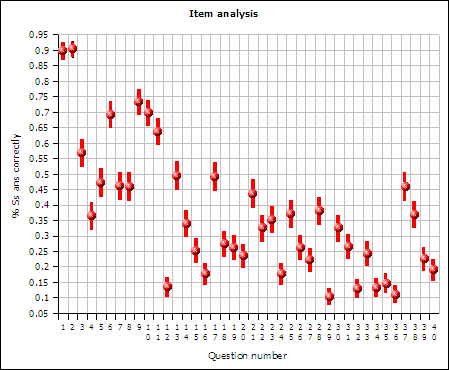
1: Student performance by question
Item Analysis and Other Statistics
Fall 2006 Mathematics Entrance Examination
College of Micronesia-FSM
Compiled by Dana Lee Ling based on the
data gathered by the
Institutional Research and Planning Office
This report would not have been possible without the support and efforts of the Institutional Research and Planning Office. For the first time in the history of the present entrance examination, an item analysis for the mathematics entrance examination was possible due to the use of optical character mark technologies.
In summary the questions on the mathematics entrance behave remarkably well. The examination, which doubles as the mathematics placement test, is designed such that questions are progressively more difficult. Student performance should fall from the first question to the last question. This overall pattern of performance is observed.
Illustration
1: Student performance by question
The analysis also showed that there are a few questions that are not performing as designed. This analysis provides the first guidance on what types of questions were difficult for students and what types were easy for students.
Illustration one graphically depicts the result of the item analysis. The red balls depict the percentage of students who answered a question correctly. The red lines depict the extent of the 95% binomial probability confidence interval for the percent correct. The examination consists of forty questions, the question number is on the horizontal axis.
There are 454 students from Chuuk, Pohnpei, and Yap campuses in the above analysis. Kosrae data was not available at the time that the analysis was done.
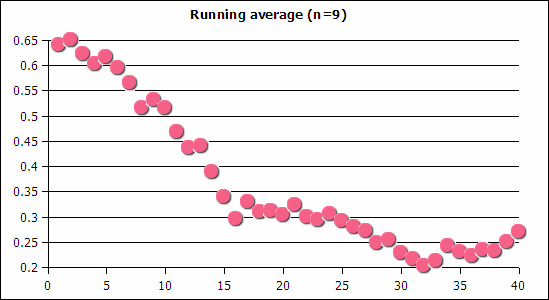
As a general pattern, student performance drops as the questions become progressively more difficult. Understanding whether the performance of a particular question is unusual requires taking into account this drop. A control chart typically uses the z-score based on an overall average to determine outliers, but the average would be inappropriate given that there is a trend in the underlying data. A running average was calculated for a span of nine questions, depicted in illustration two.
Illustration
2: Running average across a span of nine questions
The running average falls in a fairly smooth manner, suggesting that the test is performing as designed. There is a rise in the final few questions. The average is pulled up in part by yes/no binary questions in which students stand a 50% chance of being correct or wrong and a trinary multiple choice question which has a 33% potential random rate for being correct.
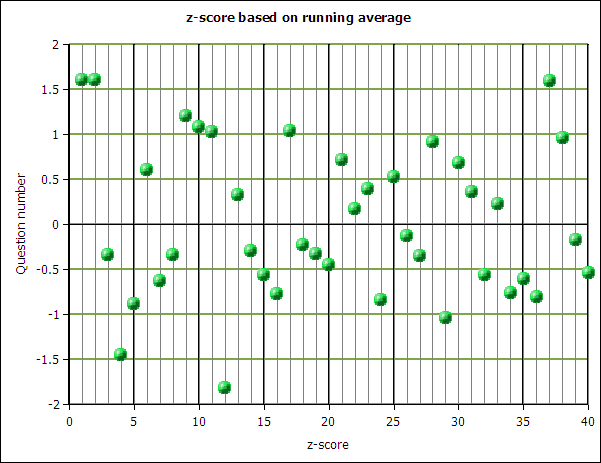
Using the running average, a z-score for each question was obtained.
Illustration
3: Z-score control chart
Notes by question for large absolute values of z:
Question 1: addition of two whole numbers.
Question 2: multiplication of two whole numbers
These two questions are intentionally designed to be trivially easy. Students missing these two questions are almost certainly innumerate.
Question 4: Greatest common factor. Students had difficulty with this question.
Question 12: Absolute value signs ( | | ). The below random performance is a clear indication that virtually no student in these three states had any idea as to the meaning of these vertical bars.
Question 17: Given the price of three packs of ramen, how much would 24 packs cost. Students performed above the running average on this problem.
Question 29: Factor a quadratic of the form ax² + bx + c where a > 1. Students appear to have more experience with factoring x² + bx + c where a =1. Once the lead coefficient exceeds one, students have difficulty with the problem.
Question 37: Given five coordinate pairs, determine if the pairs represent a function. There are three possible answers: yes, no, and insufficient information. Random for this question would be 33%. The running average at this point is 23% correct, so simply guessing will result in an unusually high score.
Other Statistics
Student math placement by state in which the examination was taken:
|
|
State |
|
||
|
Placement |
Chuuk |
Pohnpei |
Yap |
Total Result |
|
MS 095 |
182 |
93 |
19 |
294 |
|
MS 096 |
13 |
97 |
14 |
124 |
|
MS 099 |
2 |
25 |
1 |
28 |
|
MS 100 |
|
5 |
|
5 |
|
MS 101 or 150 |
|
3 |
|
3 |
|
Total Result |
197 |
223 |
34 |
454 |
Table 1: Placement by course and state
Note that math placement is not an indication of whether a student has been admitted to the associates degree level.
Placement performance by state remains highly variable and inconsistent. This is potentially of matter of some concern as these students include a large number who are presently in classes at their state campus.
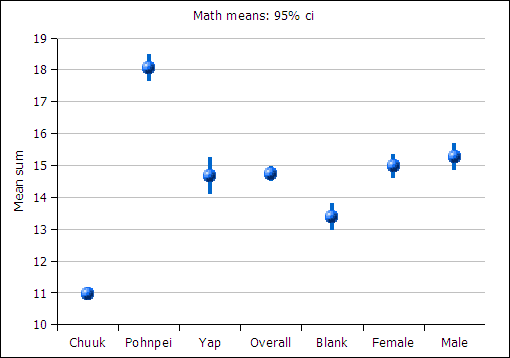
The use of electronic marking also permitted a look at the average by state and gender.
Illustration
4: Mean mathematics score by subgroups
The mean is indicated by the ball at the center of the vertical line in illustration four. The 95% confidence interval for the mean is given by the extent of the vertical bars. The average sum by subgroups shows a statistically significant and unusually poor performance for students at Chuuk campus. There is no statistically significant overall difference in performance by gender.
Illustration five indicates potential differential performance by gender in Pohnpei where males outscored females and in Yap where females outscored males. Note that of the 454 students, 101 did not indicate their gender. Table two provides details on the underlying sample size for illustration five.
|
|
Sex |
|
||
|
State |
BLANK |
Female |
Male |
Total Result |
|
Chuuk |
55 |
70 |
72 |
197 |
|
Pohnpei |
43 |
98 |
82 |
223 |
|
Yap |
3 |
15 |
16 |
34 |
|
Total Result |
101 |
183 |
170 |
454 |
Table 2: Sample sizes by state and gender
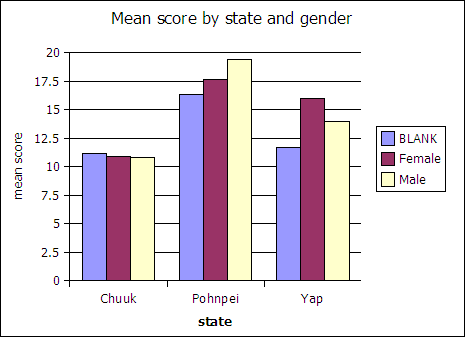
Illustration
5: Gender by state specifics
The differences do not suggest that a gender bias is exhibited by the mathematics examination.
The data provided also permitted a look at age versus total correct. Although the correlation was weak, -0.21, there is the suggestion of a negative trend in performance with age.
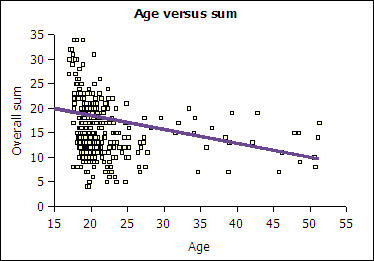
Illustration
6: Trend in total correct with age
Although this is a result that mathematics faculty might expect, the result provides statistical backing for what was suspected anecdotally. This indicates that it will not be sufficient to simply appoint a director in charge of adult continuing and community education and expect that adult learners will be recruited and then succeed at the college. Adult learners are going to require more student service support services and more tutoring than the younger learners.